
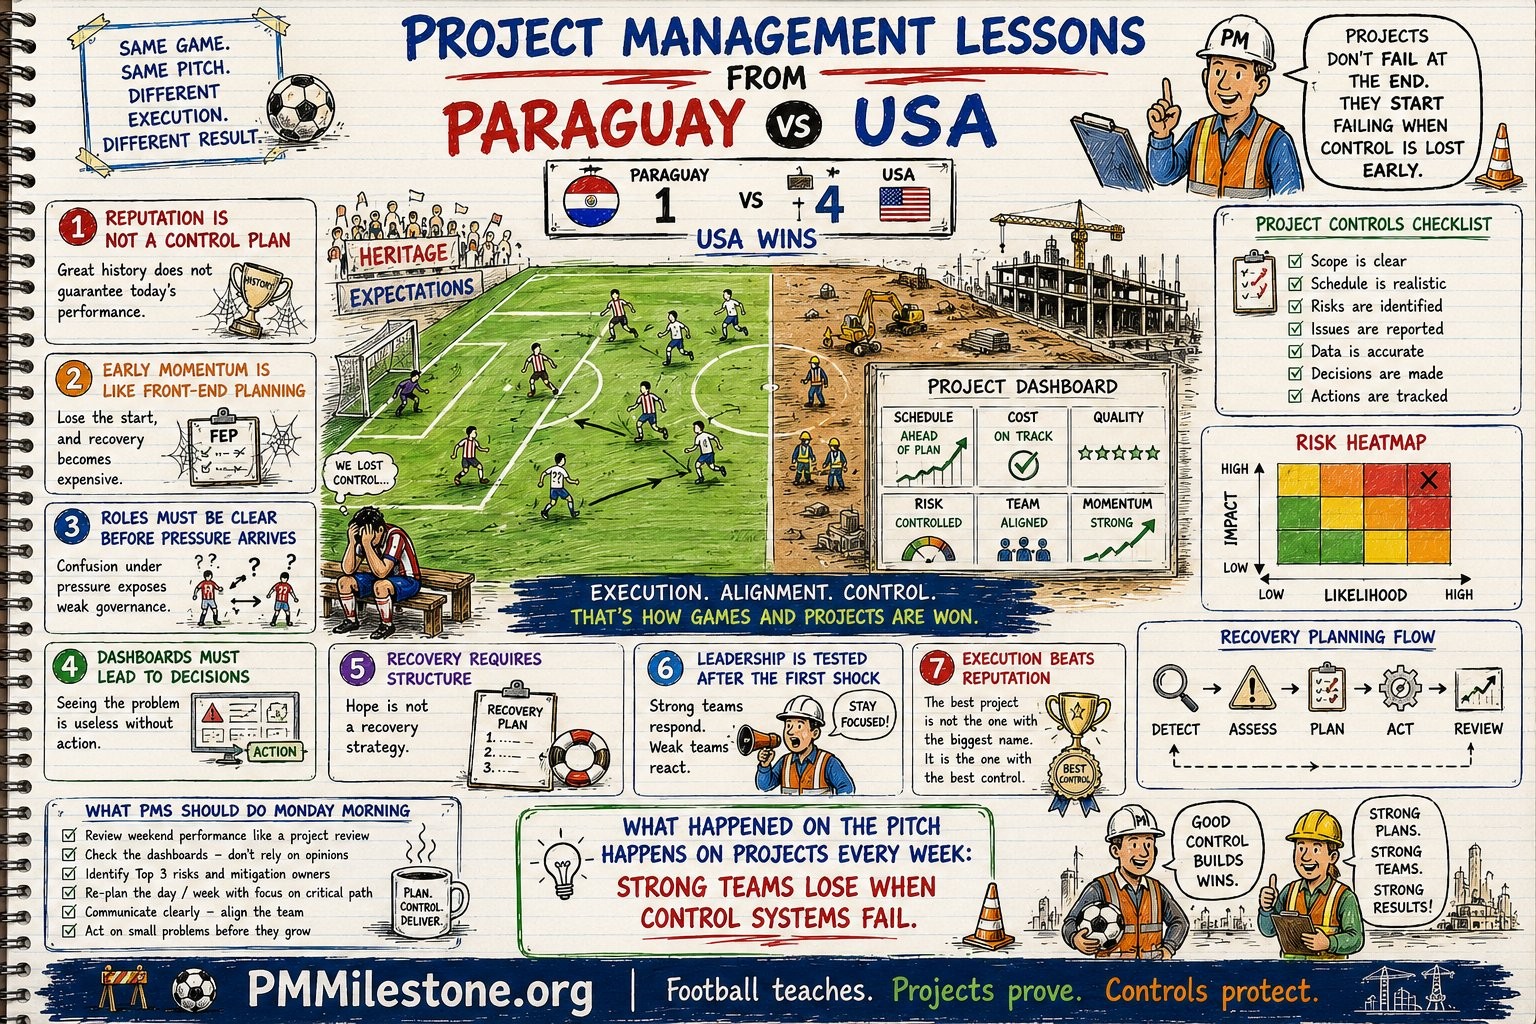
When a Strong Team Loses Control
Project lessons from Paraguay 1 – 4 USA, told from the site office


I have watched a lot of football and run a lot of project controls, and the two keep teaching me the same lesson. A scoreline of 1–4 is not really a story about control. On paper, the losing side had heritage, experienced players and a serious reputation. On the pitch, none of that survived the first thirty minutes once the structure slipped. If you have ever stood in a site meeting watching a "strong" project quietly fall apart, you already know the feeling.
That is exactly why this match makes such a good teaching case. Swap the stadium for a construction site and the analogy is almost uncomfortable. A capable team, a confident plan, and then a string of small, unmanaged events that compound into a result nobody wanted. Below, I will walk through what happened through a project controls lens — the dashboards, the failure chain, the recovery roadmap — and tie each point back to jobs I have actually worked on.
Two teams, two projects, two dashboards
When I diagnose a troubled job, I do not start with blame. I start with the dashboard. A dashboard does not have opinions; it shows you where control is holding and where it is leaking. The infographic below frames both sides of the match as project dashboards, and the contrast is stark — not because one team had better players, but because one project was being controlled and the other was not.
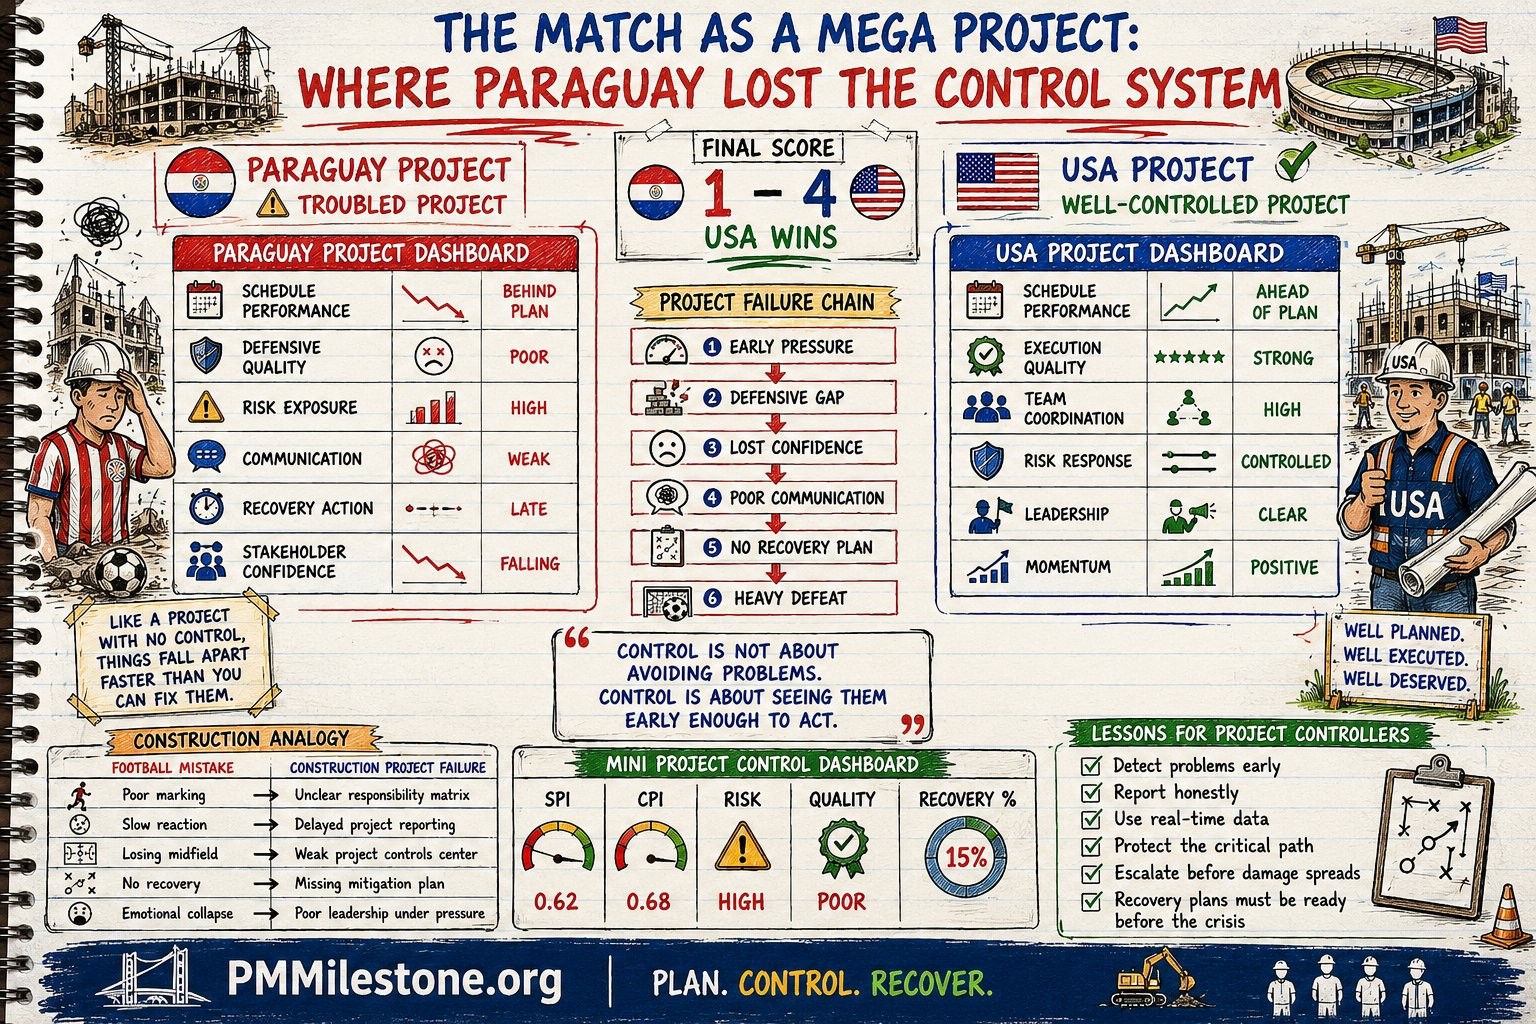
Read the two columns the way you would read a weekly report. One side shows schedule slipping behind plan, poor quality, high risk exposure, weak communication, late recovery action and falling stakeholder confidence. The other shows the opposite across the board. Here is the same comparison as a table I could drop straight into a steering report:
| Control area | Troubled project 🔴 | Controlled project 🟢 | What it really measures |
|---|---|---|---|
| Schedule performance | Behind plan | Ahead of plan | Are we keeping the critical path? |
| Execution quality | Poor | Strong | Rework, defects, first-time-right |
| Risk exposure / response | High, uncontrolled | Controlled | Are risks owned and mitigated? |
| Communication | Weak | Clear | Does information reach decision-makers in time? |
| Recovery action | Late | Ready / early | How fast can we respond to a slip? |
| Stakeholder confidence | Falling | Positive | Do sponsors still believe the plan? |
The failure chain: how 1–0 becomes 1–4
No project fails at the end. It starts failing the moment control is lost early, and then the failure cascades. The match shows this perfectly. Early pressure was not absorbed; a defensive gap opened; confidence dropped; communication broke down; there was no recovery plan; and the scoreline ran away. On a construction job the chain looks identical — only the vocabulary changes.
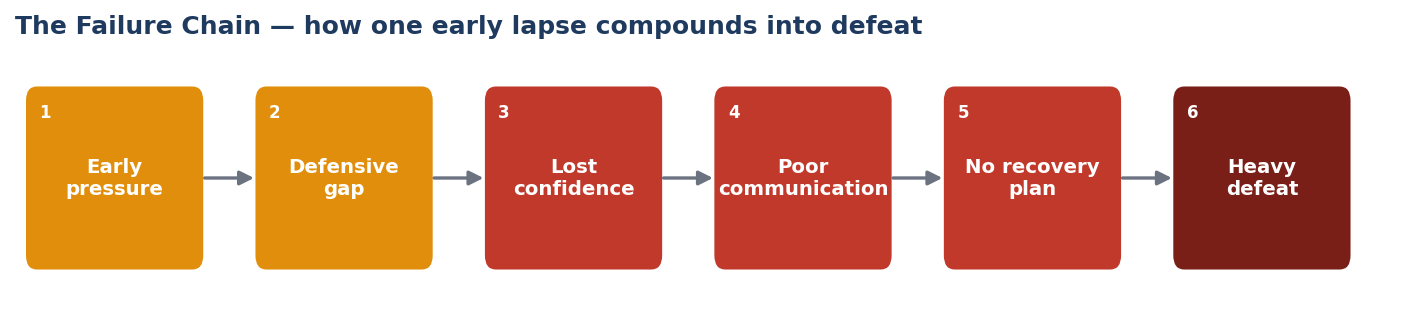
| # | On the pitch | On the project | Where it bites |
|---|---|---|---|
| 1 | Early pressure | First slip on the critical path goes unflagged | Week 2–3, when the baseline is still 'fine' |
| 2 | Defensive gap | No mitigation plan or float to absorb the slip | Procurement and early works |
| 3 | Lost confidence | Team stops trusting the programme | Daily huddles turn into excuses |
| 4 | Poor communication | Reports get optimistic; bad news travels slowly | Monthly report vs. site reality |
| 5 | No recovery plan | Nobody owns the catch-up logic | When the client finally asks 'how do we recover?' |
| 6 | Heavy defeat | Schedule and cost overrun, claims, reputation hit | Handover, final account, the next tender |
A real example: the wastewater plant that lost the first month
On a wastewater treatment upgrade I supported, the contractor lost roughly three weeks in the very first month — a late geotechnical result delayed the foundations for a new clarifier. Three weeks does not sound fatal. The problem was that nobody treated it as a control event. There was no early-warning flag, no time-impact analysis, and crucially no recovery logic. By the time it surfaced in the monthly report, the slip had already pushed concrete pours into a wet-weather window, which pushed mechanical installation, which pushed commissioning. The original three weeks became nearly three months at handover. The defensive gap in week three is what eventually produced the 'heavy defeat' at the end.
What the numbers were already telling us
Here is the uncomfortable truth: in most troubled projects, the data turns red weeks before the people do. If you are tracking earned value honestly, the Schedule Performance Index (SPI) and Cost Performance Index (CPI) start drifting below 1.0 long before anyone says the word 'recovery'. The chart below contrasts a project that held control against one that slipped — and notice how the controlled project takes an early dip, corrects, and holds, while the uncontrolled one degrades in a straight, predictable line.
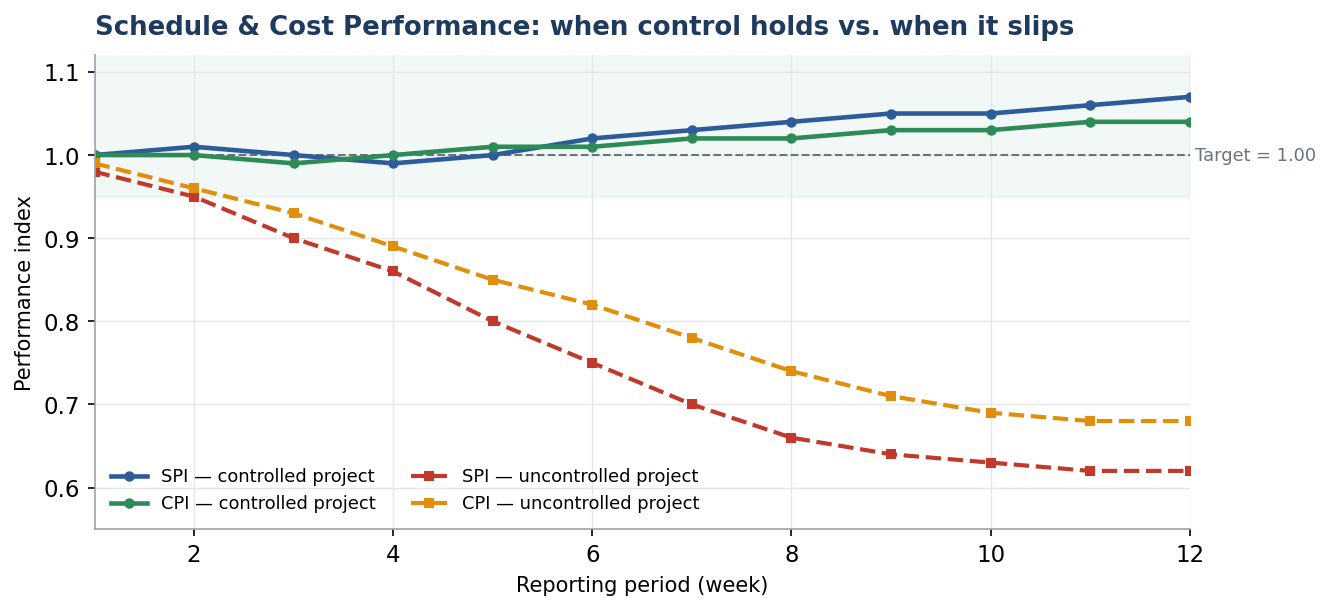
The mini-dashboard in the original infographic put the troubled project at SPI 0.62 and CPI 0.68 — both deep in the danger zone. In plain terms, that project was getting about 62 cents of schedule progress and 68 cents of cost value for every dollar planned. You do not recover from numbers like that with effort and optimism. You recover with a structured plan, owned and dated. Try the math yourself with the SPI calculator and CPI calculator, or model the whole picture in the EVM calculator.
| Index | Reading | Interpretation | Action threshold |
|---|---|---|---|
| SPI = 1.00 | On schedule | Earning value at the planned rate | Maintain & monitor |
| SPI 0.90–0.95 | Early warning | Slip beginning — investigate now | Flag in weekly report |
| SPI < 0.85 | Recovery zone | Material schedule erosion | Trigger recovery plan |
| CPI < 0.90 | Cost erosion | Spending ahead of value earned | Re-forecast EAC, escalate |
Recovery is a plan, not a hope
The single biggest difference between the two sides was not skill. It was the presence — or absence — of a recovery plan. 'Hope is not a recovery strategy' sounds like a slogan until you have lived the alternative. When a project slips, the controlled response is methodical: detect, diagnose, re-baseline, re-sequence and execute, with dates and owners against every step. Below is a 90-day recovery roadmap in Gantt form — the kind I would build in Primavera P6 the week a project tips into the recovery zone. See more patterns in our project recovery playbooks.
90-Day Project Controls Recovery Roadmap
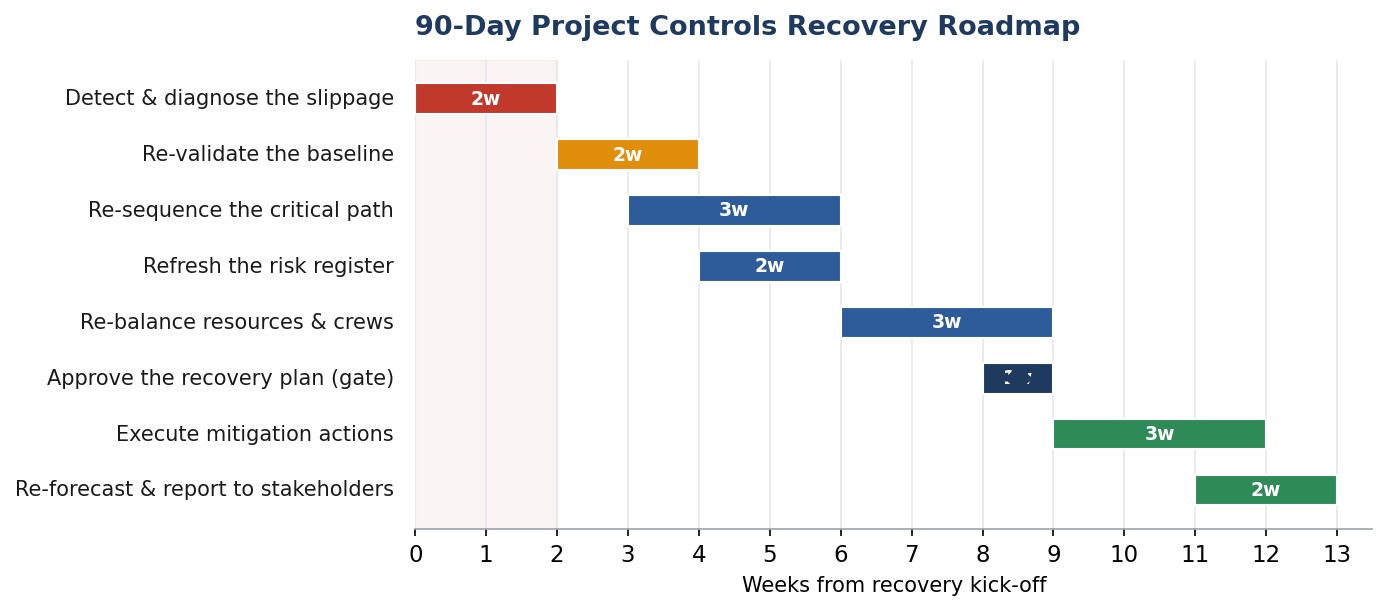
Notice the shape of it. The first two weeks are not about building — they are about seeing clearly: detecting the true extent of the slip and re-validating the baseline before anyone commits to a catch-up promise. The recovery plan is then approved at a formal gate (the diamond) before mitigation begins, so the team is not accelerating on a plan nobody signed off. This is the discipline the match was missing entirely.
- Detect & diagnose (Wk 1–2): quantify the real slip with a time-impact analysis — not a gut feel.
- Re-validate the baseline (Wk 3–4): confirm logic, durations and constraints still reflect reality.
- Re-sequence the critical path (Wk 4–6): find legitimate catch-up logic — parallel paths, re-prioritised works.
- Refresh risk & re-balance resources (Wk 5–9): update the risk register and put crews where the path needs them.
- Approve at the gate (Wk 9): a sponsor-signed recovery plan, not a verbal promise.
- Execute, re-forecast & report (Wk 9–13): act, then re-measure honestly and tell the truth in the report.
Common mistakes (and how the controlled project avoided them)
| ✗ Common mistake | What it looks like on site | ✓ The controlled habit |
|---|---|---|
| Reputation as a plan | "This contractor always delivers" — so nobody checks the early data | Earn confidence weekly from the dashboard, not from history |
| Late reporting | Slips surface in the monthly report, a month too late | Real-time data and weekly early-warning flags |
| Optimistic forecasts | EAC quietly stays green while site burns | Re-forecast honestly; escalate before damage spreads |
| No critical-path focus | Effort spreads across non-critical tasks | Protect the critical path above everything else |
| Recovery improvised | Catch-up by overtime and pressure, no owner | Recovery plan ready before the crisis, not after |
Expert tips from the site office
- Make 'early' a metric. Track how many days pass between a slip happening and a slip being flagged. If that gap is widening, your control system — not your team — is the problem.
- Run a two-minute dashboard, every day. Five indicators — schedule, cost, risk, quality, momentum — beat a fifty-page report nobody reads. The original infographic's mini-dashboard is the right instinct.
- Protect the first 30 minutes. In football it is literally the first thirty minutes; on projects it is front-end planning. Win the start and recovery stays cheap. Lose it and every fix costs more.
- Pre-write the recovery logic. Keep a standing recovery template so that when SPI dips below 0.85 you are filling in a plan, not inventing one under pressure.
- Tell the truth in reports. Honest red beats comfortable green. The controlled project's advantage started with reporting that decision-makers could actually trust.
Key takeaways
About PMMilestone.org — Free AI-Powered Project Management Tools
If this way of thinking resonates, the good news is you do not need an enterprise budget to start working like the controlled project. PMMilestone.org is a free, AI-powered project management platform built for exactly this — turning control from an idea into a daily habit. I point graduates and busy site teams to it because it removes the friction between 'I should track this' and actually tracking it.
What you get on PMMilestone.org: a genuinely free, ad-supported toolkit built by working project professionals, not a paywalled SaaS funnel. The platform combines calculators, learning content and reference material in one place so you can plan, control and recover without juggling ten different apps.
| Feature | What it does | Why it matters on real projects |
|---|---|---|
| 34+ free calculators 🧮 | EVM (SPI/CPI/EAC), schedule, cost, earned value, productivity and risk tools | Run the numbers in seconds instead of rebuilding spreadsheets every week |
| PM Academy 🎓 | Structured lessons across planning, scheduling, cost and risk control | Up-skill site engineers and graduates without an expensive course |
| 120+ term glossary 📚 | Plain-English definitions of project controls and contract terminology | A shared vocabulary stops the "communication gap" that sinks projects |
| AI-powered assistance 🤖 | Guidance and templates that speed up everyday controls tasks | Less time formatting, more time managing the critical path |
| Elite Project Controls (EPCT) ⭐ | A deeper system for practitioners who want to operate at a senior level | A path from "using tools" to "owning the controls function" |
The bottom line: control is a discipline, not a personality trait — and the right tools make that discipline repeatable. Explore the full toolkit free at PMMilestone.org.
Continue Learning
More Learning Tracks from the Project Controls Academy.

Construction Claims Career Path
A practical roadmap for engineers moving from site delivery into planning, delay analysis, claims, commercial controls and senior claims consulting.
Read track
Project Controls Digital Transformation Roadmap
A future-focused guide to modern project controls through data integration, reporting automation, Power BI, AI, BIM and digital PMO capability building.
Read track
Project Controls Fundamentals
Scope, schedule, cost, risk, quality and reporting — the six disciplines that hold every successful capital project together, taught from first principles.
Read track
Earned Value Management
From PV / EV / AC to SPI, CPI, EAC, ETC, VAC and TCPI — the full toolkit for measuring and forecasting project performance.
Read trackFeatured Academy Learning Pages
The latest Academy tracks and knowledge pillars, sorted newest first.
Time Impact vs Windows Analysis
A practitioner's guide to forensic delay methods — TIA vs windows analysis, concurrency under the SCL Protocol, and the evidence that turns an analysis into an entitlement.
Read article
Negative Float in Primavera P6
A field guide from 120+ schedule audits: what negative float really means in P6, the six root causes, and the repair workflow that fixes causes rather than hiding symptoms.
Read article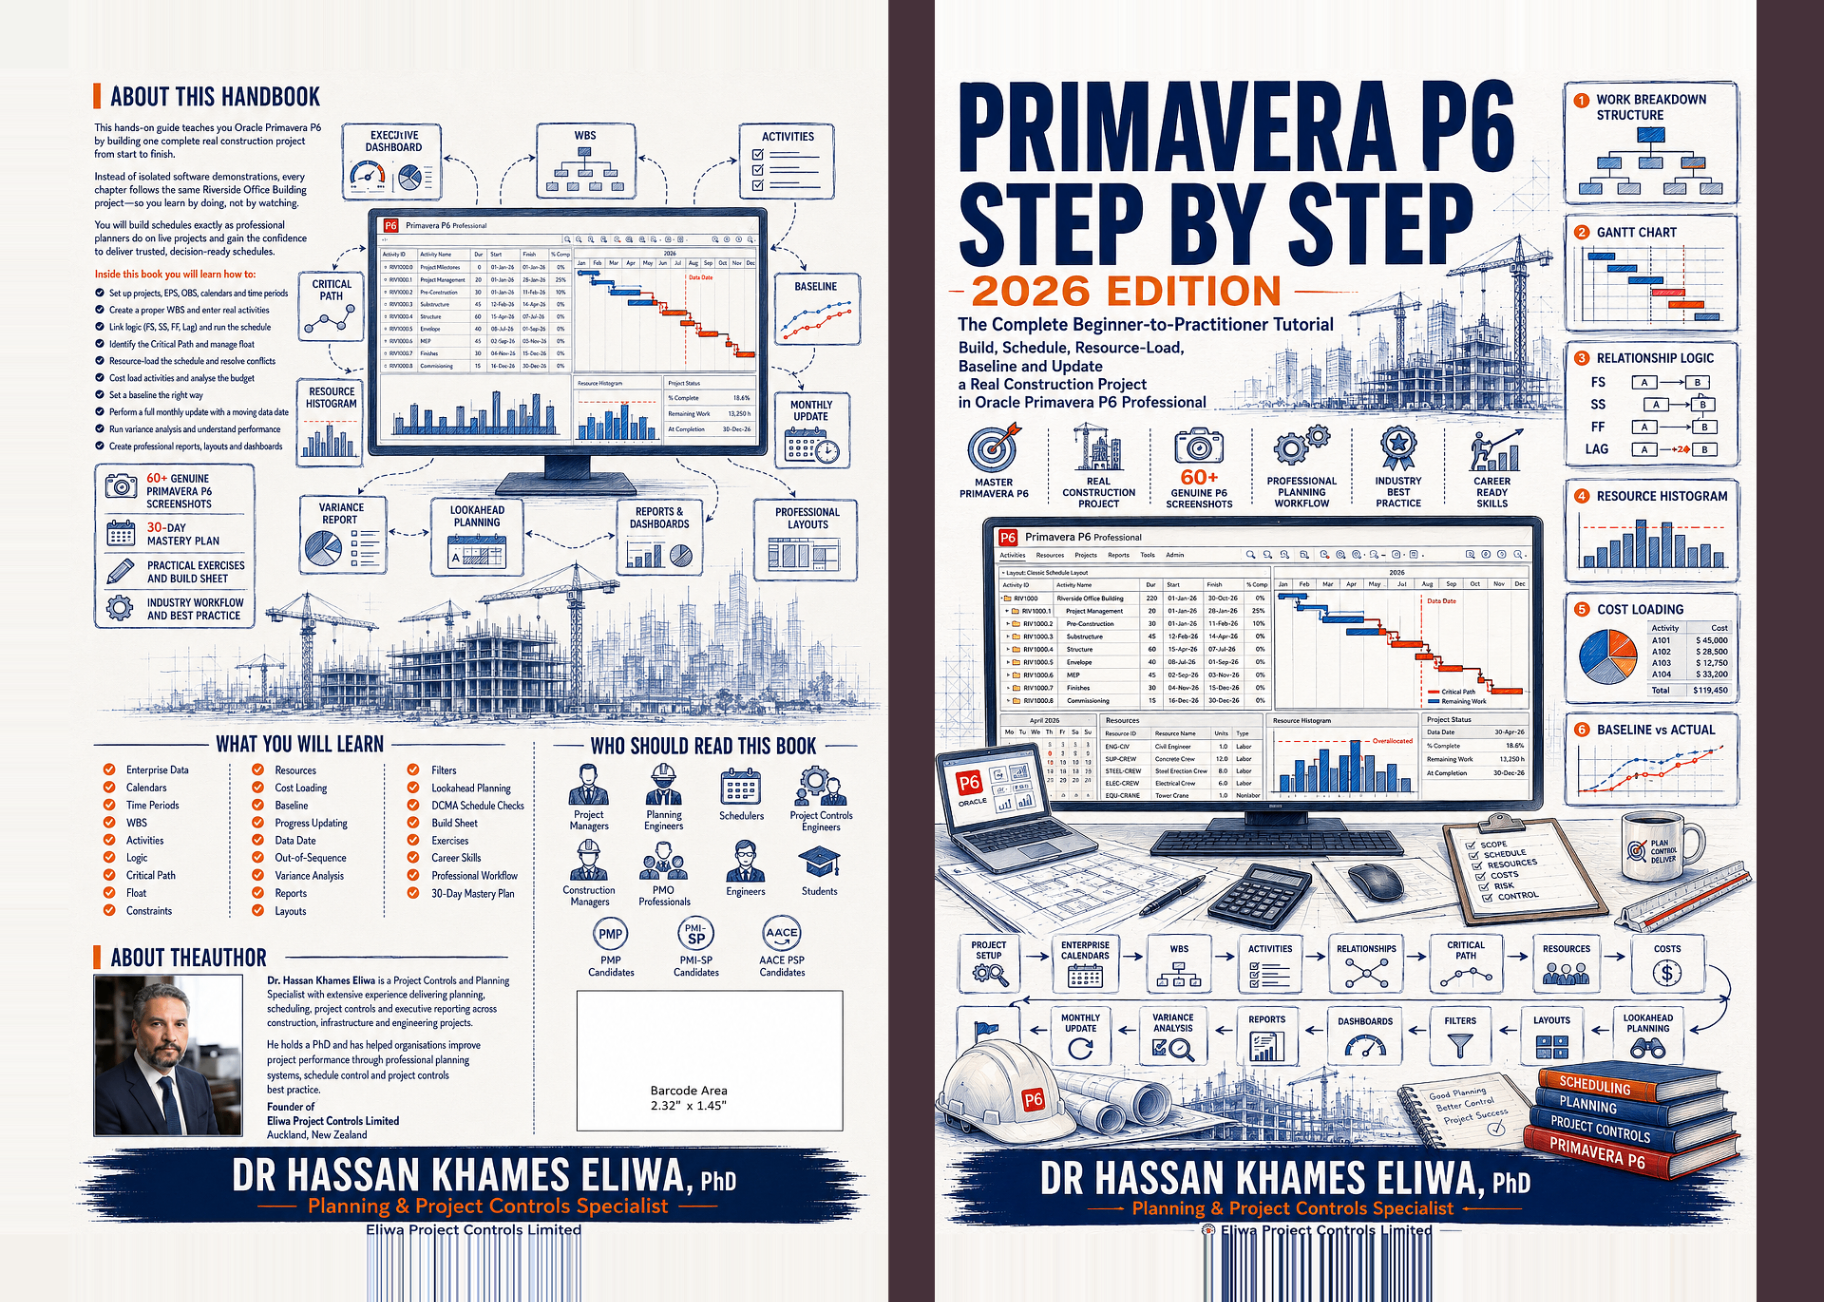
Why Most People Never Really Learn Primavera P6
An editorial review of Primavera P6 Step by Step — 2026 Edition by Dr. Hassan Khames Eliwa: one continuous Riverside Office Building project, 60+ genuine screenshots, calendars, WBS, logic, baselines, resource loading, and a full monthly update.
Read article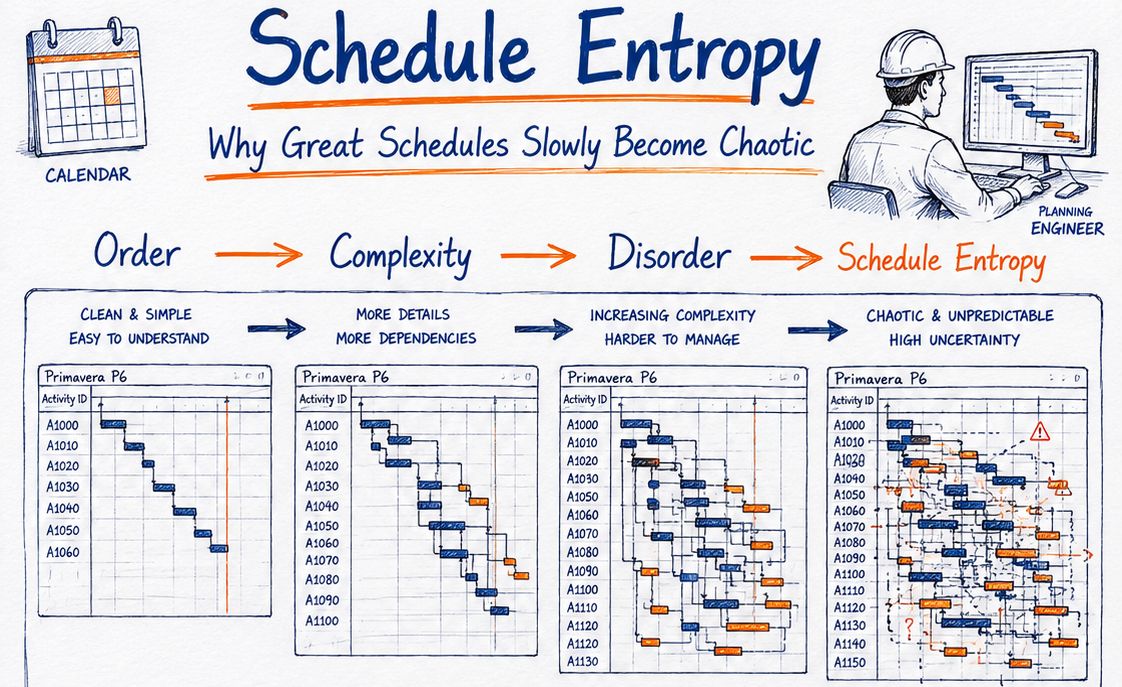
Schedule Entropy
Every planner has watched a beautiful baseline decay into chaos over a few update cycles. Schedule entropy is the mental model that explains why — and how to stop it.
Read article
How Expert Planners Read a Primavera P6 Schedule in Just 10 Minutes
The exact five-pass sequence experienced planners use to size up an unfamiliar Primavera P6 programme before a meeting starts — and the warning signs they never miss.
Read article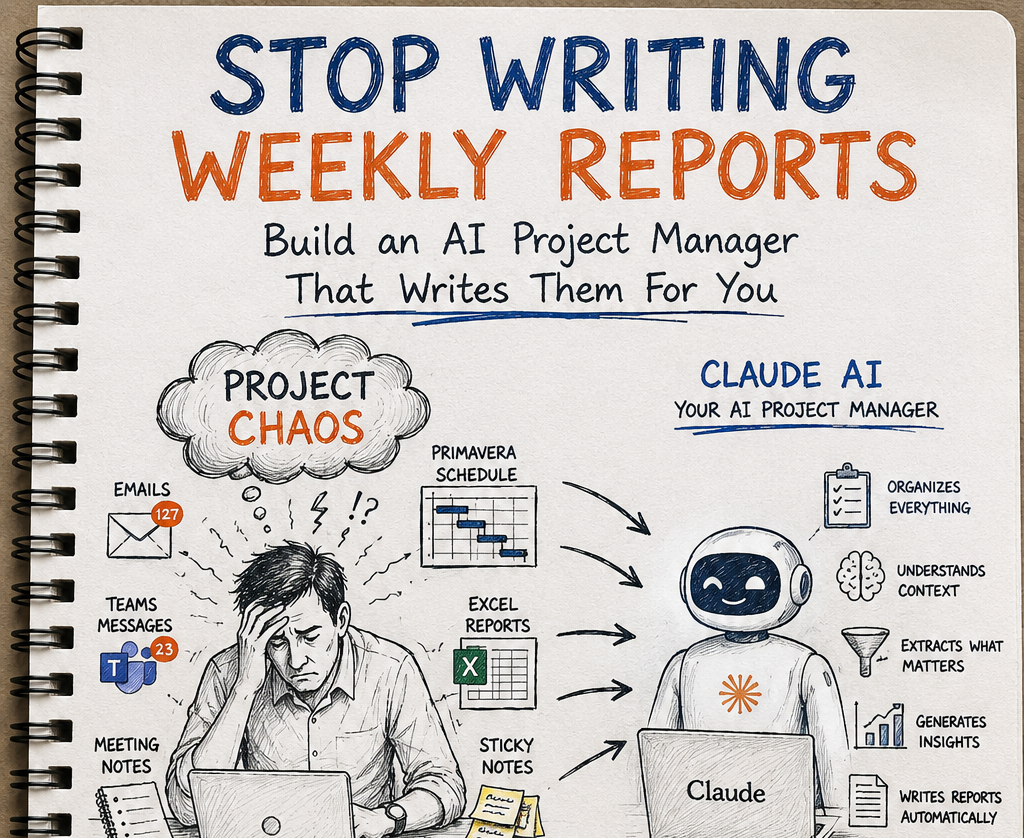
Stop Writing Weekly Reports
A field guide for planners, project controls leads and delivery managers — how to set up an AI project manager that captures the noise as it happens and writes the weekly report for you, so your time goes back into judgement, not formatting.
Read article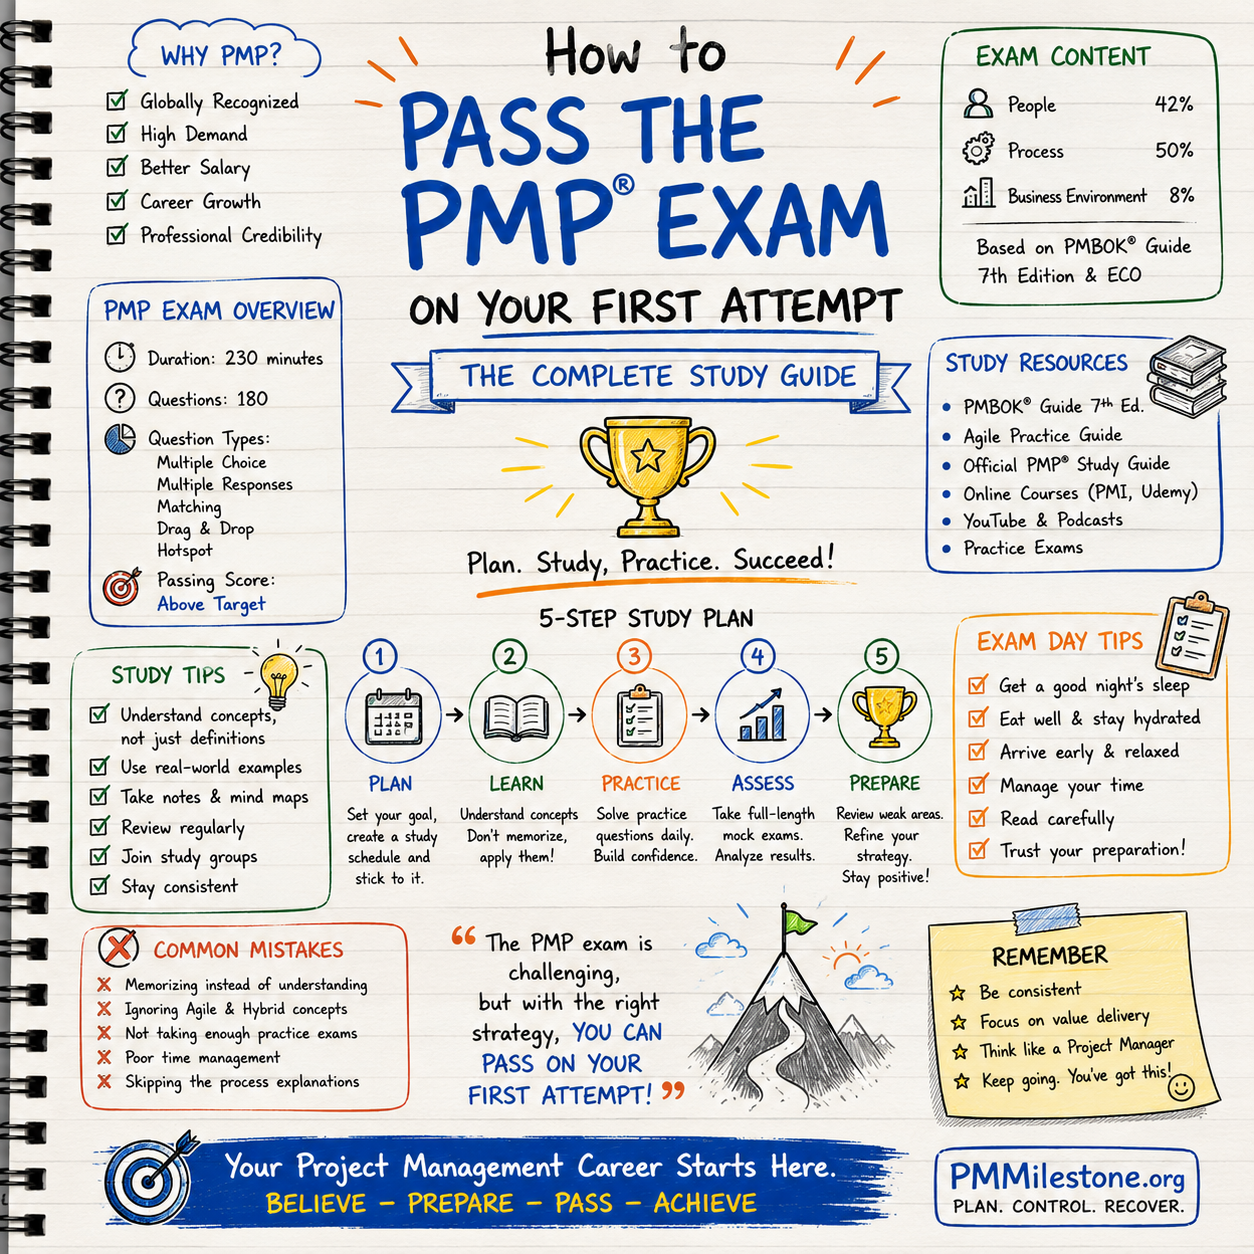
How to Pass the PMP® Exam on Your First Attempt
A complete, practitioner-written PMP study guide — exam format, ECO domain weightings, an 8-week study plan, common mistakes and an exam-day playbook to pass on the first attempt.
Read article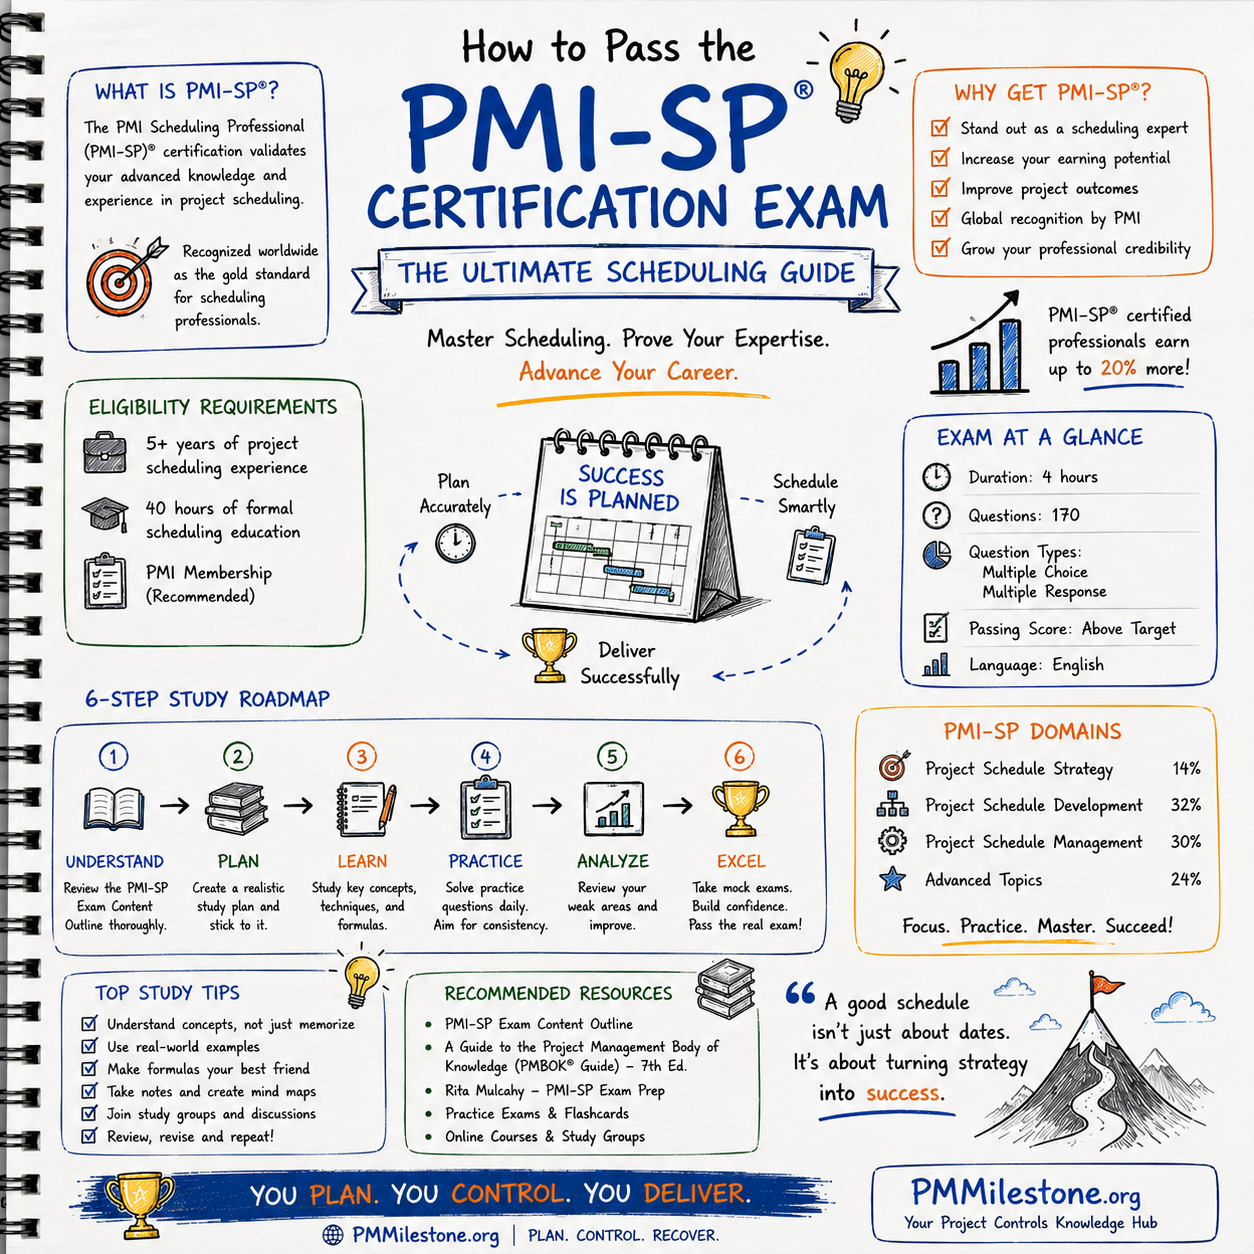
How to Pass the PMI-SP® Certification Exam
A planner-written guide to the PMI-SP credential — real exam format, five-domain weighting from the current ECO, eligibility paths, a ten-week study plan and the formulas worth knowing cold.
Read article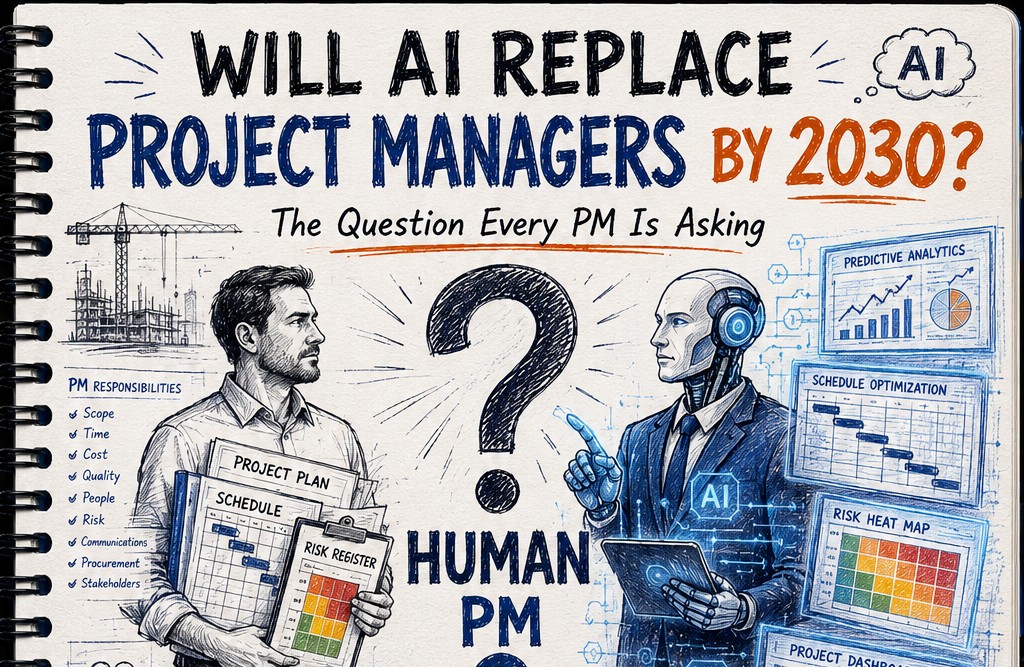
Will AI Replace Project Managers by 2030? A Practical, No-Hype Guide
A practical, no-hype answer to the question every PM is asking — what AI will automate, what it can't replace, and how to make yourself more valuable as the tools improve.
Read article
Project Controls Certification Guide (2026)
PMP, PMI-SP, PMI-RMP, AACE CCP, AACE PSP and EVP compared — choose the right certification path for planning, cost and controls professionals.
Read article
Planning Engineer to Controls Director
A practitioner's career roadmap with skills, certifications and salary at every stage — from junior planner to director of project controls.
Read article
Earned Value Management — Ultimate Guide
PV, EV, AC, CPI, SPI, EAC, TCPI, S-curves and a worked construction example — the definitive EVM reference for project controls practitioners.
Read article
Construction Delay Analysis & EOT Claims
Delay analysis methods, EOT claims, concurrency, prolongation cost and recovery strategies — the full forensic playbook for construction delay disputes.
Read articleWhen a Strong Team Loses Control — Paraguay vs USA
What can project managers learn from Paraguay's 1–4 loss to USA? Project controls lessons on risk, recovery planning, dashboards, SPI, CPI and leadership — told from the site office.
Read article
Project Controls Leadership Roadmap
A practical leadership roadmap from junior project controls engineer to director, with role-by-role expectations, technical and leadership skill progression, salary examples and long-range development plans.
Read article
Mega Project Learning Path
A practical learning path for understanding how large infrastructure projects are governed, planned, reported and controlled across PMO, schedule, cost, risk and executive decision layers.
Read article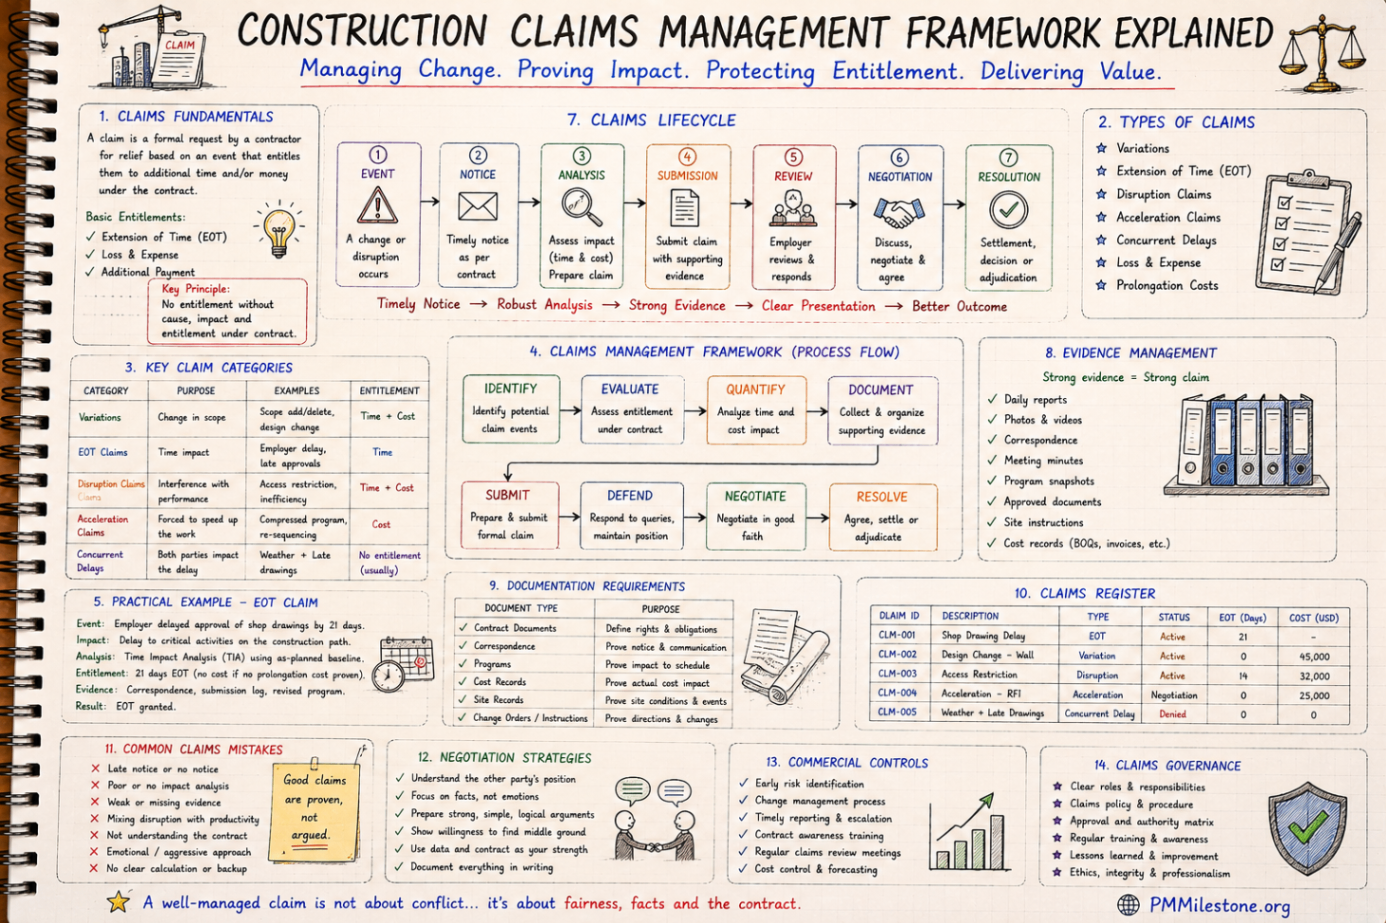
Integrated Project Controls Framework Explained
A complete explanation of the integrated project controls framework: the core disciplines, how the data connects, where integration fails and what mature delivery looks like.
Read article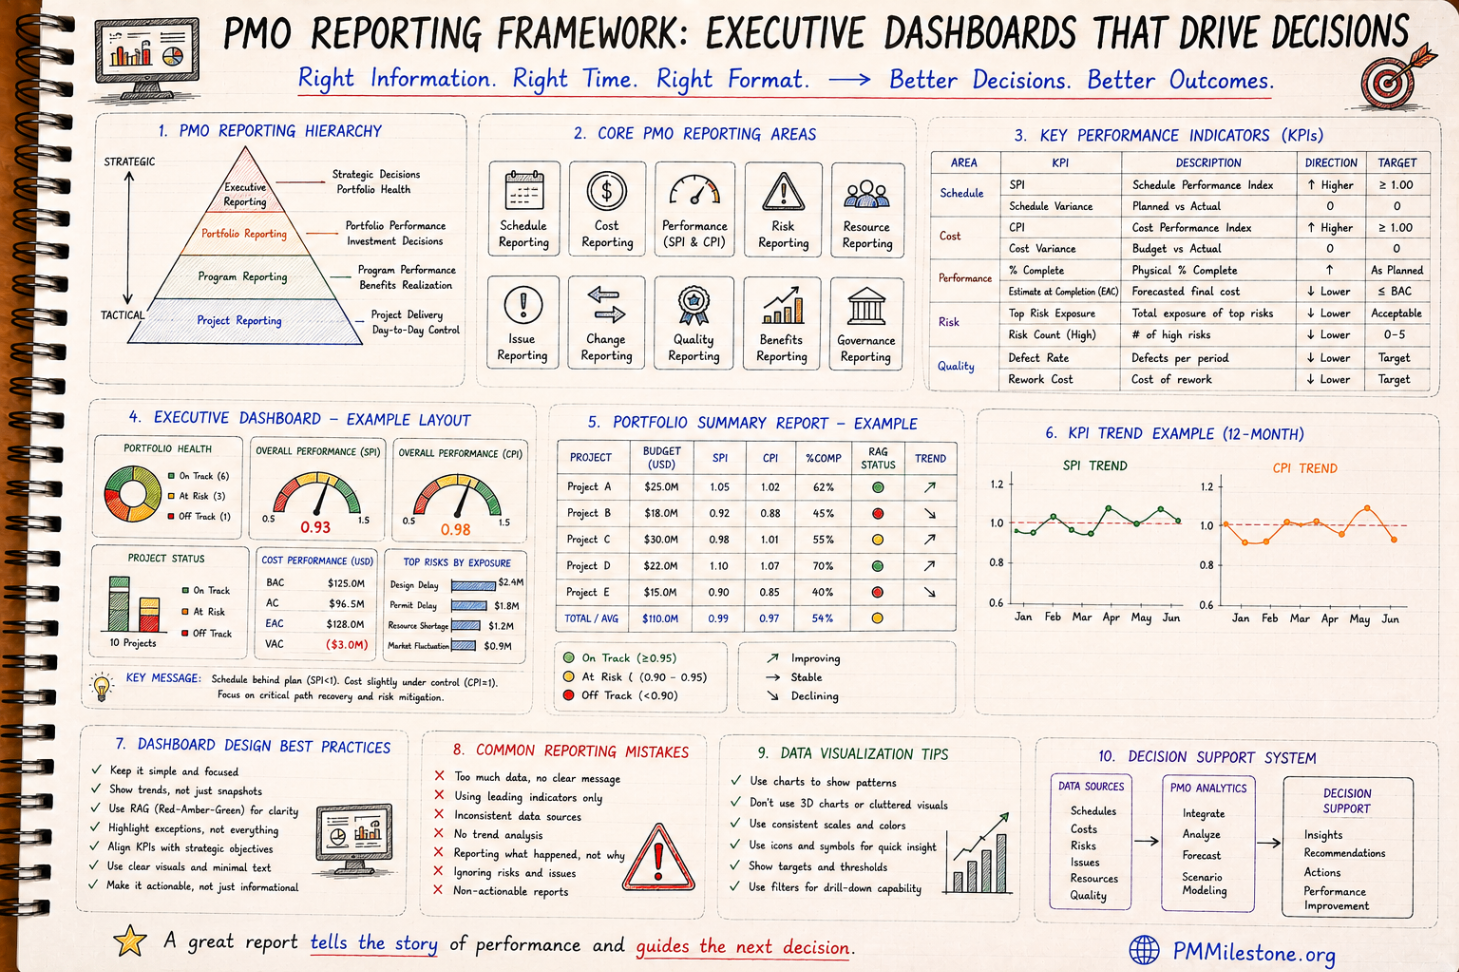
Project Controls KPIs Explained
A practical KPI guide covering the project controls metrics that actually drive decisions, from SPI and CPI to EAC, VAC, productivity, PMO and executive dashboard KPIs.
Read articleConstruction Claims Career Path
A practical roadmap for engineers moving from site delivery into planning, delay analysis, claims, commercial controls and senior claims consulting.
Read articleProject Controls Digital Transformation Roadmap
A future-focused guide to modern project controls through data integration, reporting automation, Power BI, AI, BIM and digital PMO capability building.
Read articleUpgrade to Enterprise-Level Project Intelligence
Discover the Elite Project Controls System — a professional intelligence framework for modern project controls, forecasting, executive reporting, AI PM workflows and risk management.
- ★Executive-grade KPI frameworks
- ★AI-powered project workflows
- ★Forecasting & risk intelligence
- ★PMO-ready reporting templates