Earned Value Management: The Complete Practitioner's Guide to PV, EV, AC and the Performance Indices
 Written by Dr. Hassan Eliwa, PhD 10 min read
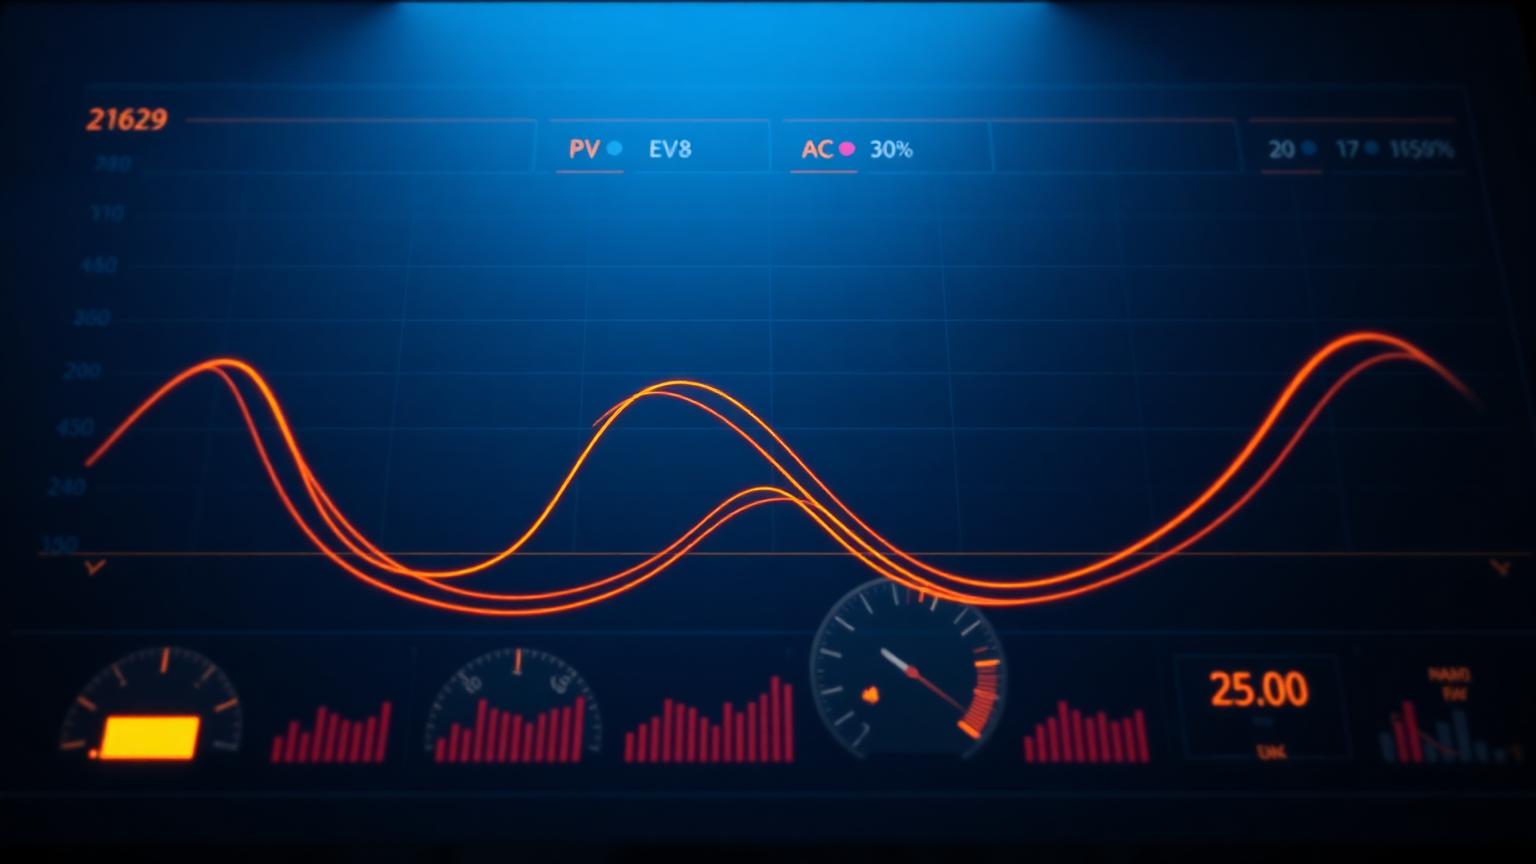
Why EVM still matters
Earned Value Management is the only widely used technique that integrates scope, schedule and cost into a single set of numbers. That integration is what makes it valuable — and also what makes it controversial. Done well, EVM gives executives a clear, comparable, forecast-ready picture of project health. Done badly, it produces glossy curves that hide the real story.
The technique is over fifty years old, but the underlying logic remains the gold standard for federal capital programmes, oil and gas megaprojects, defence procurement and increasingly for large IT and infrastructure portfolios. Even teams that do not run formal EVM benefit from the discipline its formulas impose.
The three core measurements
Every EVM calculation starts from three numbers. Planned Value (PV) is the budgeted cost of the work that should have been done by the data date. Earned Value (EV) is the budgeted cost of the work that has actually been done. Actual Cost (AC) is what was actually spent to do that work.
All three are expressed in the same currency, which is what makes the comparisons possible. The art is not in the formulas; it is in measuring EV honestly. Weight factors, percent-complete rules and milestone-based earning techniques all change the EV number dramatically, and the integrity of every downstream metric depends on this discipline.

The performance indices: SPI and CPI
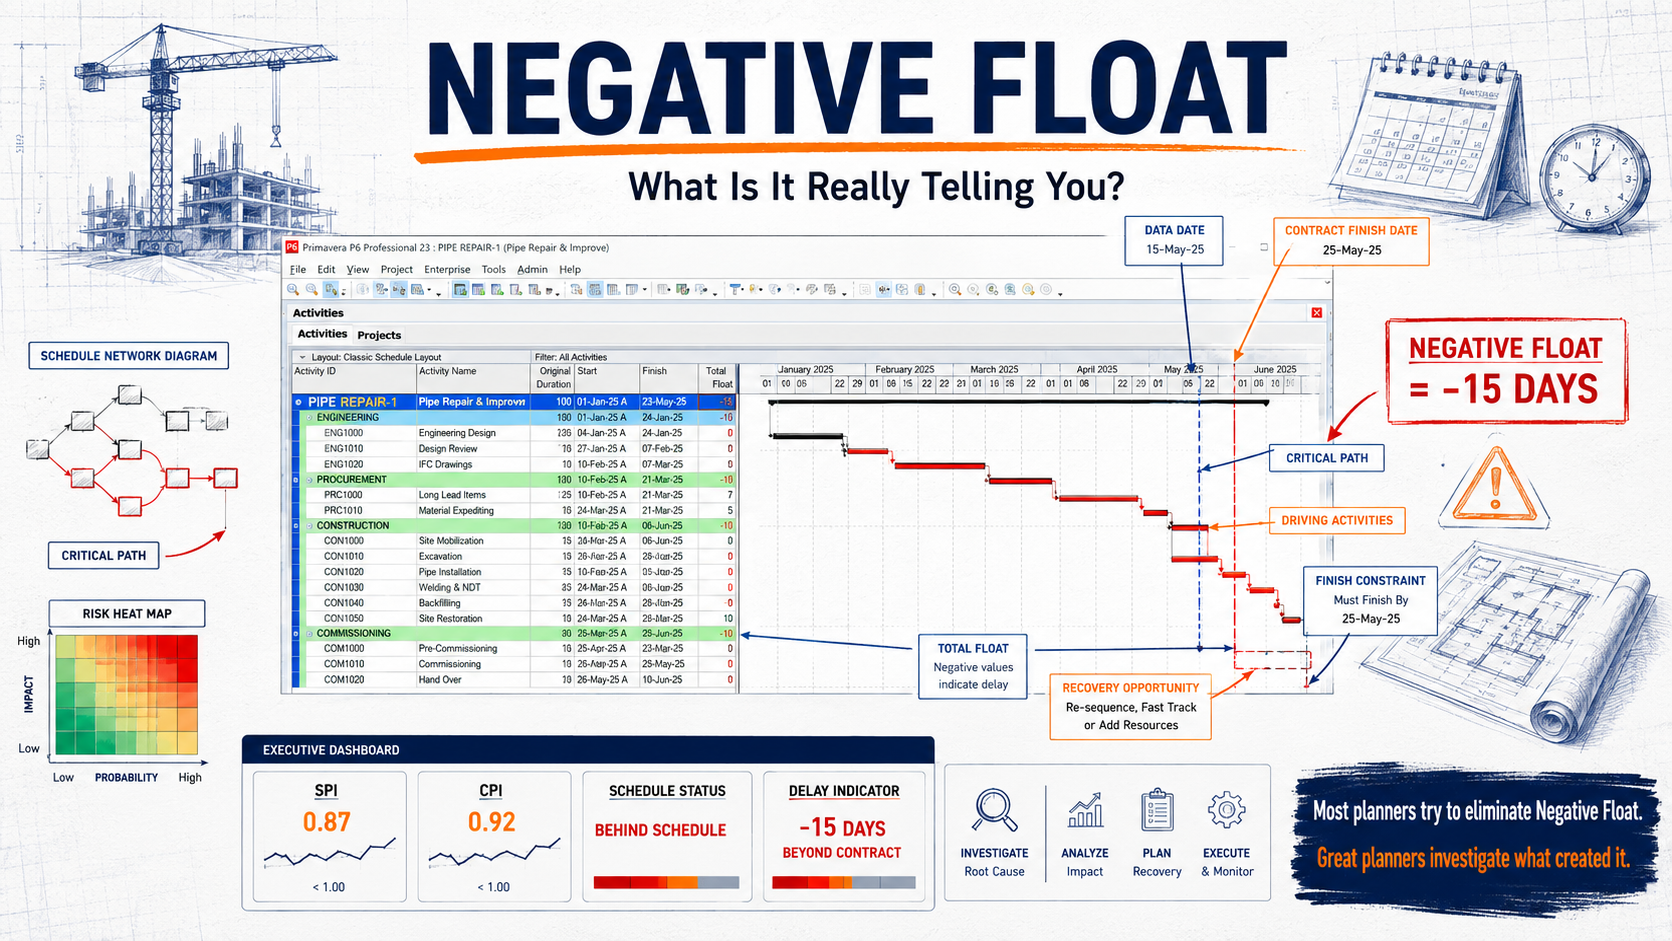
Schedule Performance Index (SPI) is EV divided by PV. A value of 1.0 means you have earned exactly what you planned to earn by now. Below 1.0 you are behind; above 1.0 you are ahead. Cost Performance Index (CPI) is EV divided by AC and reads the same way for cost efficiency.
SPI and CPI are deliberately dimensionless so they can be compared across projects, contractors and portfolios. They are not, however, equally trustworthy. SPI loses its meaning near the end of a project because the schedule eventually catches up regardless of pace; for late-stage forecasting, earned schedule techniques and direct schedule analysis are more reliable.

Variances: SV, CV and how to read them
Schedule Variance (SV) is EV minus PV. Cost Variance (CV) is EV minus AC. Both are expressed in currency. A negative SV means you have earned less work than you planned for; a negative CV means the work you earned cost more than you budgeted.
Variances are useful precisely because they are absolute. SPI tells you how efficient you are; SV tells you how much real work you are behind on. Senior stakeholders almost always respond better to a dollar figure than a ratio, so reporting should usually pair the two.
Forecasting: EAC, ETC, VAC and TCPI
The forecast family of metrics is where EVM moves from measurement into decision support. Estimate at Completion (EAC) projects what the project will ultimately cost. The most common version assumes current cost efficiency continues: EAC = BAC / CPI, where BAC is the original budget at completion. Other variants assume future work returns to plan, or weight CPI and SPI together for an integrated efficiency assumption.
Estimate to Complete (ETC) is simply EAC minus AC — how much more you expect to spend. Variance at Completion (VAC) is BAC minus EAC — how far over or under budget you will finish. To-Complete Performance Index (TCPI) is the efficiency required for the remaining work to hit either BAC or EAC. TCPI values much greater than 1.0 are an early warning that the current plan is no longer credible.
Common mistakes — and how to avoid them
The biggest EVM mistakes are not mathematical. They are about discipline. Inflating EV with optimistic percent-complete estimates corrupts every downstream metric. Mixing apples and oranges across cost accounts hides bad performance behind good. Updating the schedule without re-baselining the cost curve creates phantom variances that no one can explain.
The remedy is unglamorous: clear earning rules per work-package type, monthly discipline on data quality, and a controls team that is allowed to report bad news without political consequence. Used this way, EVM becomes the most powerful forecasting tool in the project controls toolkit.
From metrics to action
The point of EVM is not to produce a number; it is to drive a decision. A CPI of 0.85 should not appear in a report without a paragraph explaining what is causing it and what the recovery plan is. A TCPI of 1.4 should be paired with a recommendation: accept the overrun, descope, or accelerate.
The Academy tools — SPI, CPI, EAC, schedule variance and TCPI calculators — are designed to make this loop fast. The intent is that you can run a scenario in seconds and spend your real time on the conversation that follows.
Next steps on PMMilestone
Use these pages to deepen the topic, verify terminology, compare real cases and move from theory into applied project controls practice.
Related calculators
Open the calculators referenced in this article and run them against your own project numbers.
SPI Calculator
Schedule Performance Index — measure schedule efficiency.
Open Earned ValueCPI Calculator
Cost Performance Index — measure cost efficiency.
Open ForecastingEAC Forecast Calculator
Estimate at Completion — forecast final project cost.
Open Earned ValueSchedule Variance (SV) Calculator
Measure schedule variance in dollars.
Open ForecastingTCPI Calculator
To-Complete Performance Index — required efficiency to finish on budget.
OpenOther learning tracks

Construction Claims Career Path
A practical roadmap for engineers moving from site delivery into planning, delay analysis, claims, commercial controls and senior claims consulting.

Project Controls Digital Transformation Roadmap
A future-focused guide to modern project controls through data integration, reporting automation, Power BI, AI, BIM and digital PMO capability building.
Project Controls Fundamentals
Scope, schedule, cost, risk, quality and reporting — the six disciplines that hold every successful capital project together, taught from first principles.