
The Project Manager Cheat Sheet
Every formula and KPI a working project manager, planner or PMP candidate needs — written for printing on a single page or pinning above your desk.
Earned Value
| KPI / formula | Equation | Meaning & example |
|---|---|---|
| Planned Value (PV) | PV = % planned × BAC | Budgeted cost of work scheduled at the data date.Example: If 40% of work was planned and BAC = $1M → PV = $400k. |
| Earned Value (EV) | EV = % complete × BAC | Budgeted cost of work actually completed.Example: 30% complete on a $1M project → EV = $300k. |
| Actual Cost (AC) | AC = sum of all costs incurred | Actual cost spent to earn the EV. |
| Schedule Variance (SV) | SV = EV − PV | Negative = behind schedule (in $).Example: EV 300, PV 400 → SV = −100. |
| Cost Variance (CV) | CV = EV − AC | Negative = over budget for the work earned. |
| Schedule Performance Index (SPI) | SPI = EV ÷ PV | < 1 = behind schedule.Example: 300 ÷ 400 = 0.75. |
| Cost Performance Index (CPI) | CPI = EV ÷ AC | < 1 = over budget. |
| EAC (typical) | EAC = BAC ÷ CPI | Forecast final cost assuming current performance continues. |
| EAC (atypical) | EAC = AC + (BAC − EV) | Used when current variance is a one-off. |
| EAC (cost & schedule) | EAC = AC + [(BAC − EV) ÷ (CPI × SPI)] | Most conservative: both indices erode remaining work. |
| Estimate to Complete (ETC) | ETC = EAC − AC | Forecast cost from data date to completion. |
| Variance at Completion (VAC) | VAC = BAC − EAC | Negative = forecast overrun. |
| TCPI (to BAC) | TCPI = (BAC − EV) ÷ (BAC − AC) | Performance needed to finish at BAC. |
| TCPI (to EAC) | TCPI = (BAC − EV) ÷ (EAC − AC) | Performance needed to hit current EAC. |
Earned Schedule
| KPI / formula | Equation | Meaning & example |
|---|---|---|
| Earned Schedule (ES) | ES = time when current EV was planned to occur | Time-based equivalent of EV. |
| SPI(t) | SPI(t) = ES ÷ AT | Time-based SPI; remains meaningful late in the project. |
Float & CPM
| KPI / formula | Equation | Meaning & example |
|---|---|---|
| Total Float (TF) | TF = LS − ES (or LF − EF) | Time activity can slip without delaying project finish. |
| Free Float (FF) | FF = ES(successor) − EF(activity) | Slip allowed without delaying any successor. |
| Critical Path | Path with TF = 0 (or minimum) | Determines the shortest possible duration. |
| Forward Pass | EF = ES + Duration | Calculates early dates. |
| Backward Pass | LS = LF − Duration | Calculates late dates from the end. |
Forecasting
| KPI / formula | Equation | Meaning & example |
|---|---|---|
| Run-Rate Forecast | Forecast finish = AT + (Remaining work ÷ Productivity rate) | Simple time-to-complete based on observed rate. |
| S-Curve Variance | Variance = Actual % − Planned % | Quick schedule health check at any date. |
| Burn Rate | Burn = AC ÷ Time elapsed | Monthly cash burn used in cash-flow forecasting. |
Risk
| KPI / formula | Equation | Meaning & example |
|---|---|---|
| Expected Monetary Value (EMV) | EMV = Probability × Impact | Used to size contingency from the risk register. |
| Contingency Reserve | Sum of EMV for active risks | Quantitative basis for cost/time contingency. |
| Risk Score | Score = Probability × Impact (1-5 scale) | Prioritises register entries on the heat-map. |
| PERT Estimate | (O + 4M + P) ÷ 6 | Three-point weighted average for duration/cost. |
| PERT Standard Deviation | (P − O) ÷ 6 | Quantifies estimating uncertainty. |
PM Math
| KPI / formula | Equation | Meaning & example |
|---|---|---|
| Communication Channels | n × (n − 1) ÷ 2 | Number of two-way channels between n stakeholders. |
| Present Value | PV = FV ÷ (1 + r)^n | Discounting for NPV decisions. |
| ROI | ROI = (Gain − Cost) ÷ Cost | Business-case justification. |
| Payback Period | Payback = Investment ÷ Annual cash flow | Years until break-even. |
Delivery KPIs
| KPI / formula | Equation | Meaning & example |
|---|---|---|
| Schedule Adherence | Activities finished on time ÷ Activities planned | Reliability of weekly planning. |
| Productivity Factor (PF) | PF = Earned hours ÷ Actual hours | Site labour efficiency. |
| Change Order Ratio | Change order value ÷ Contract value | Health signal for scope discipline. |
| Safety TRIR | (Recordable injuries × 200,000) ÷ Hours worked | Standard industry safety metric. |
Featured Academy Learning Pages
The latest Academy tracks and knowledge pillars, sorted newest first.
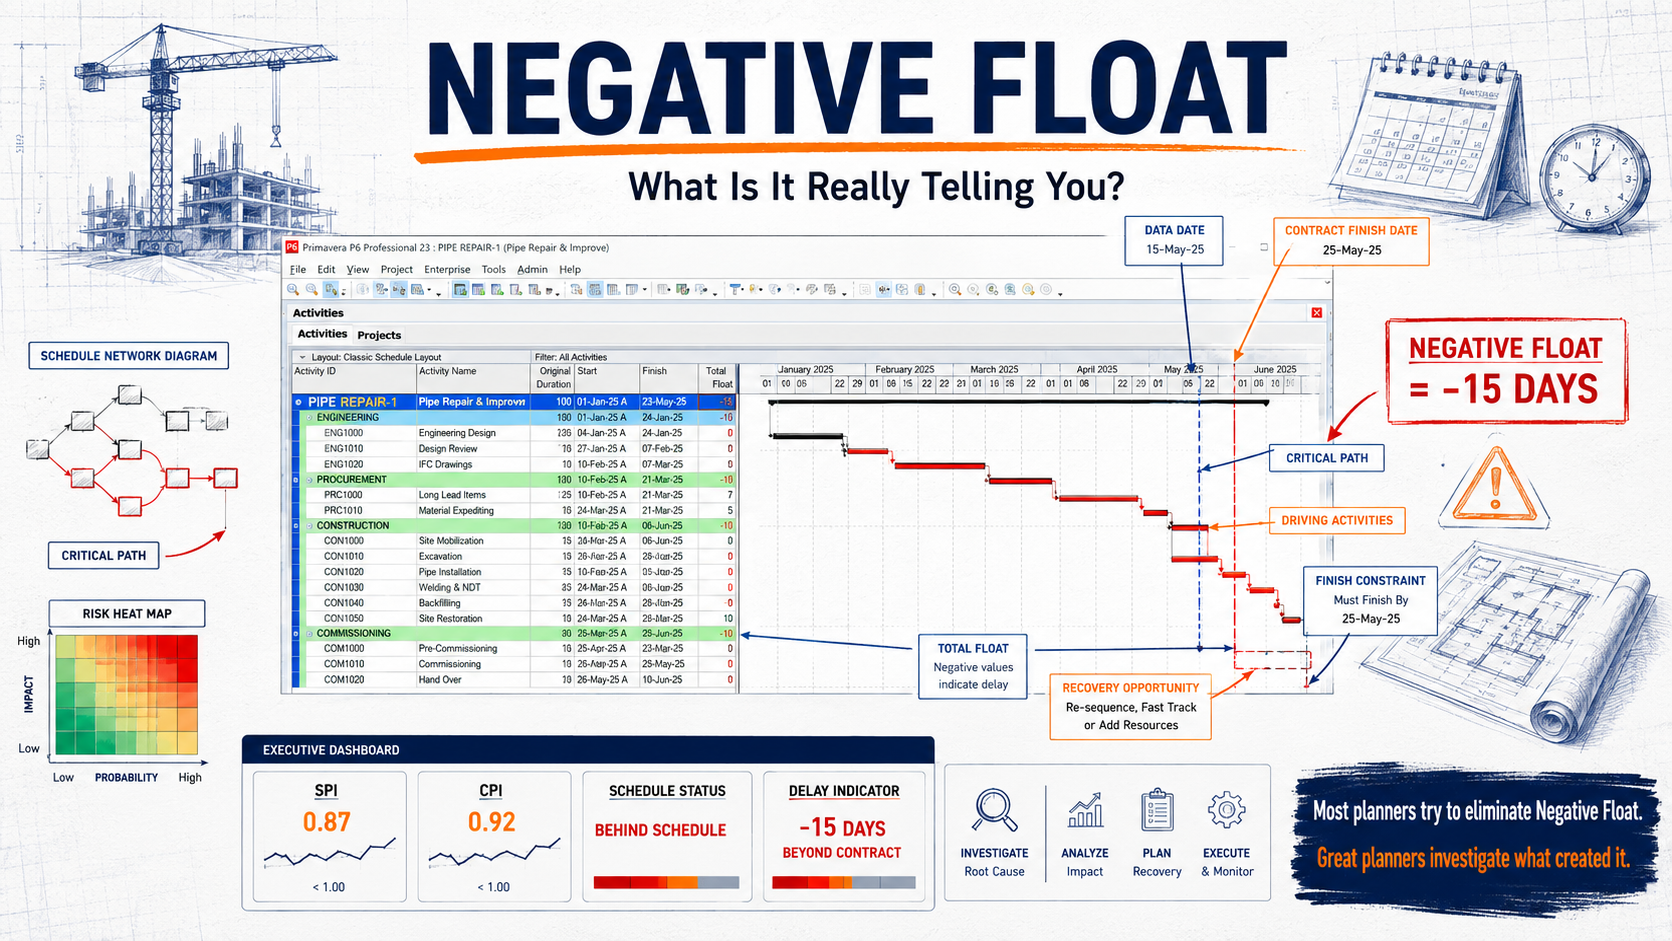
Negative Float in Primavera P6
A field guide from 120+ schedule audits: what negative float really means in P6, the six root causes, and the repair workflow that fixes causes rather than hiding symptoms.
Read article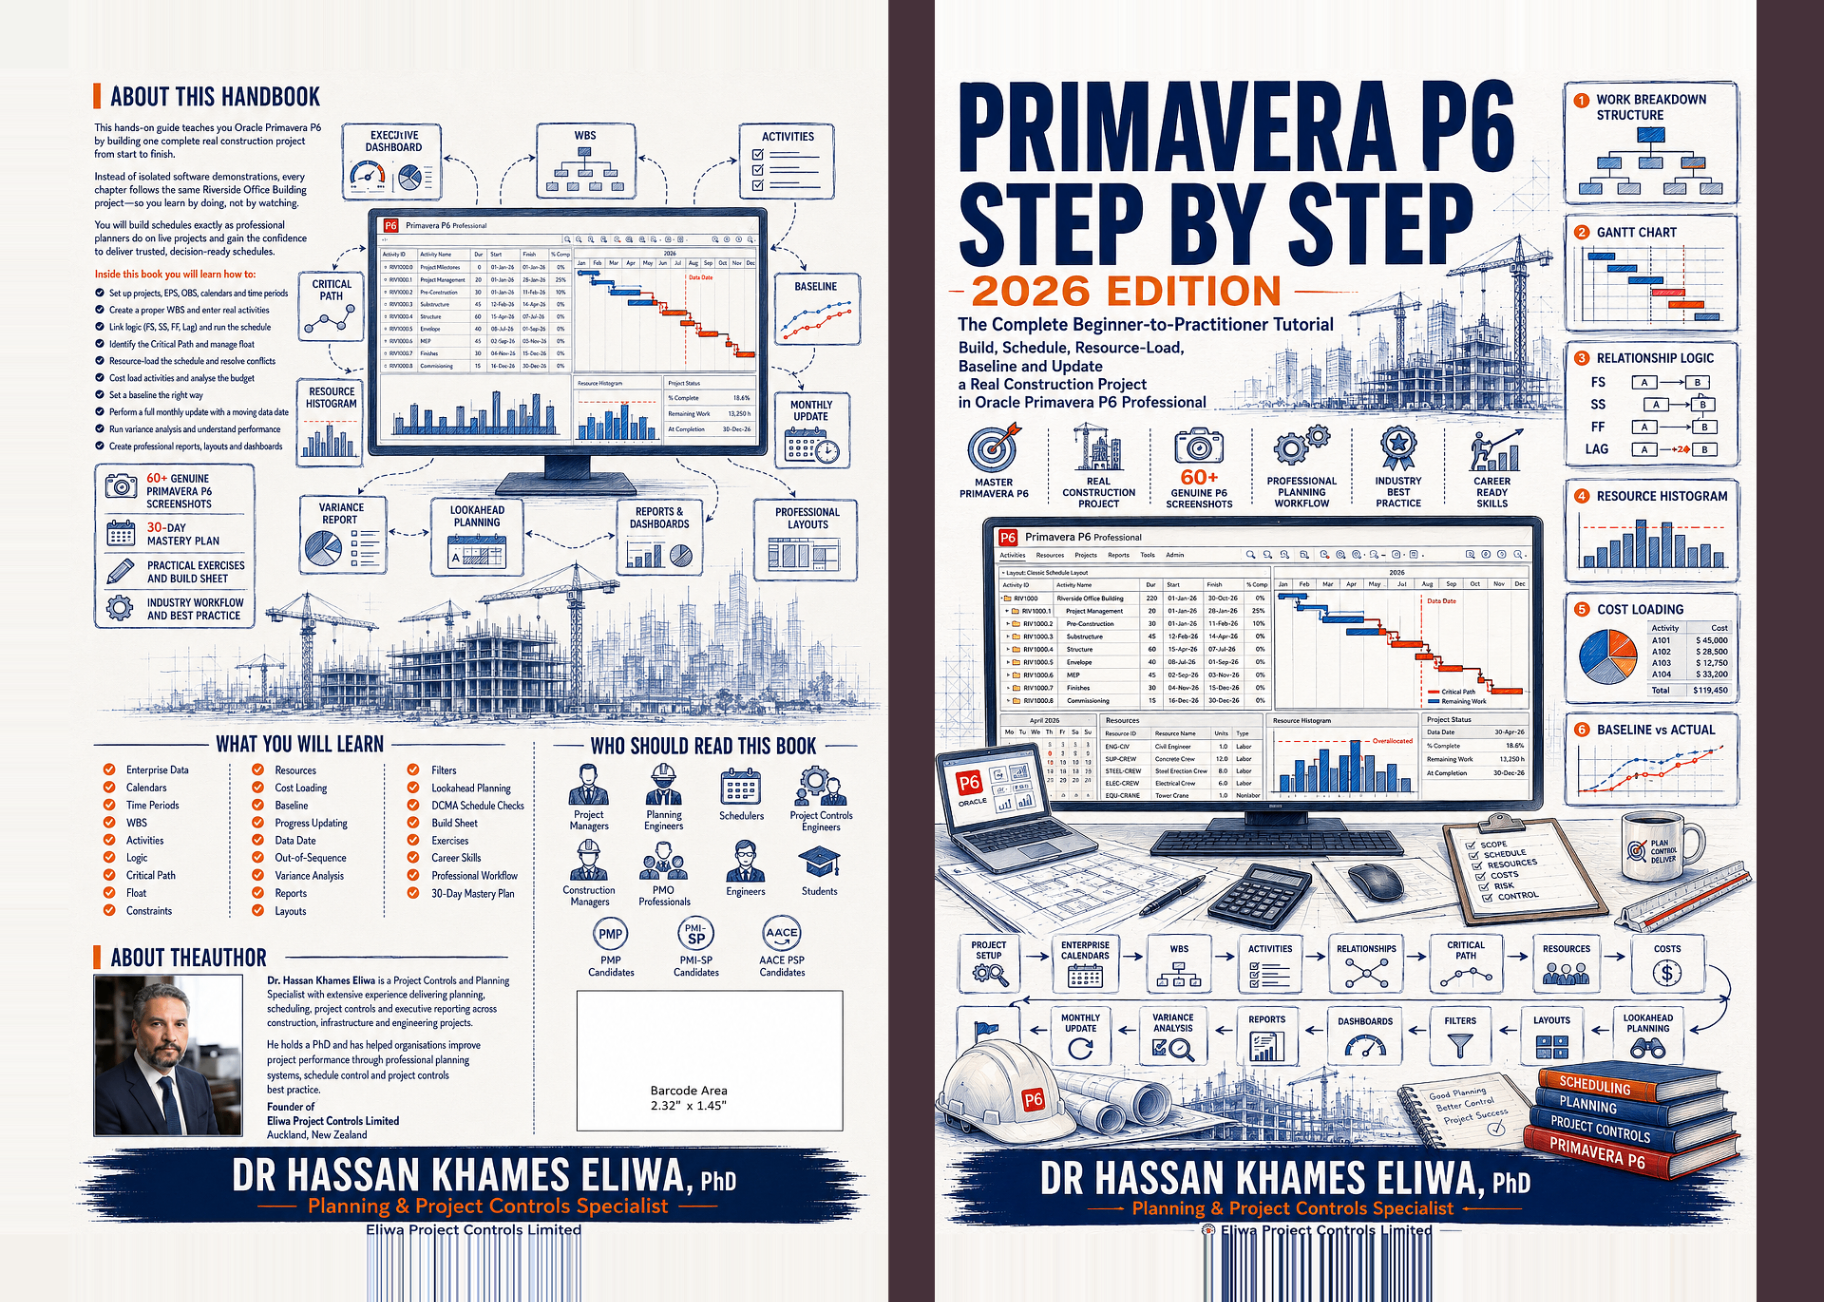
Why Most People Never Really Learn Primavera P6
An editorial review of Primavera P6 Step by Step — 2026 Edition by Dr. Hassan Khames Eliwa: one continuous Riverside Office Building project, 60+ genuine screenshots, calendars, WBS, logic, baselines, resource loading, and a full monthly update.
Read article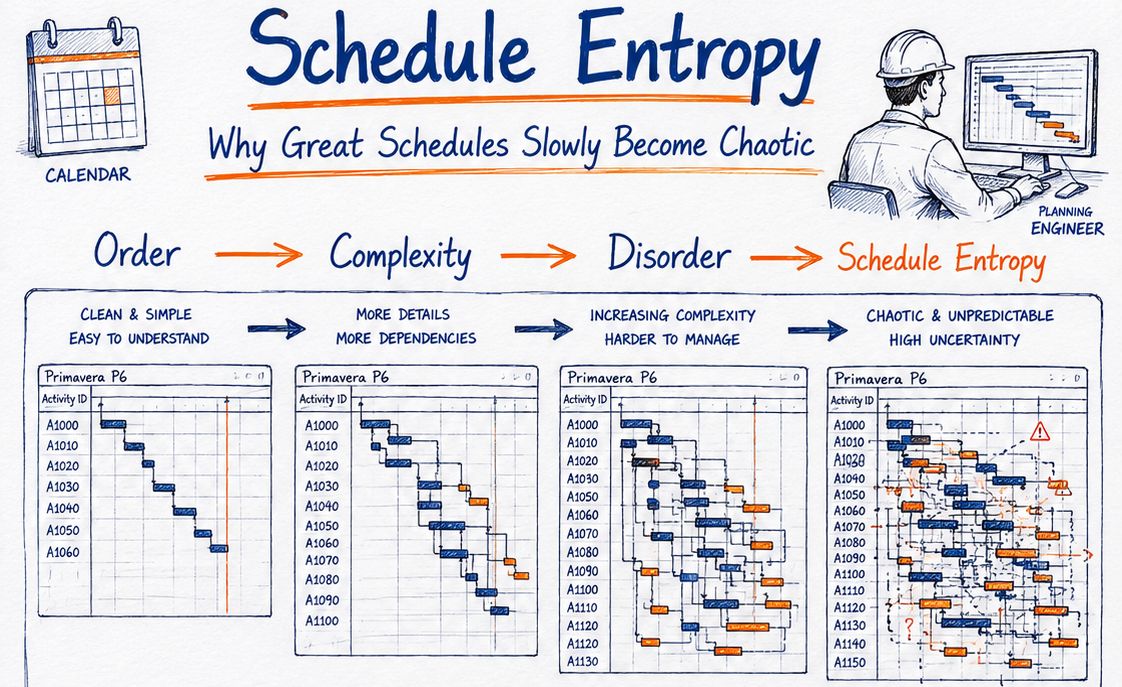
Schedule Entropy
Every planner has watched a beautiful baseline decay into chaos over a few update cycles. Schedule entropy is the mental model that explains why — and how to stop it.
Read article
How Expert Planners Read a Primavera P6 Schedule in Just 10 Minutes
The exact five-pass sequence experienced planners use to size up an unfamiliar Primavera P6 programme before a meeting starts — and the warning signs they never miss.
Read article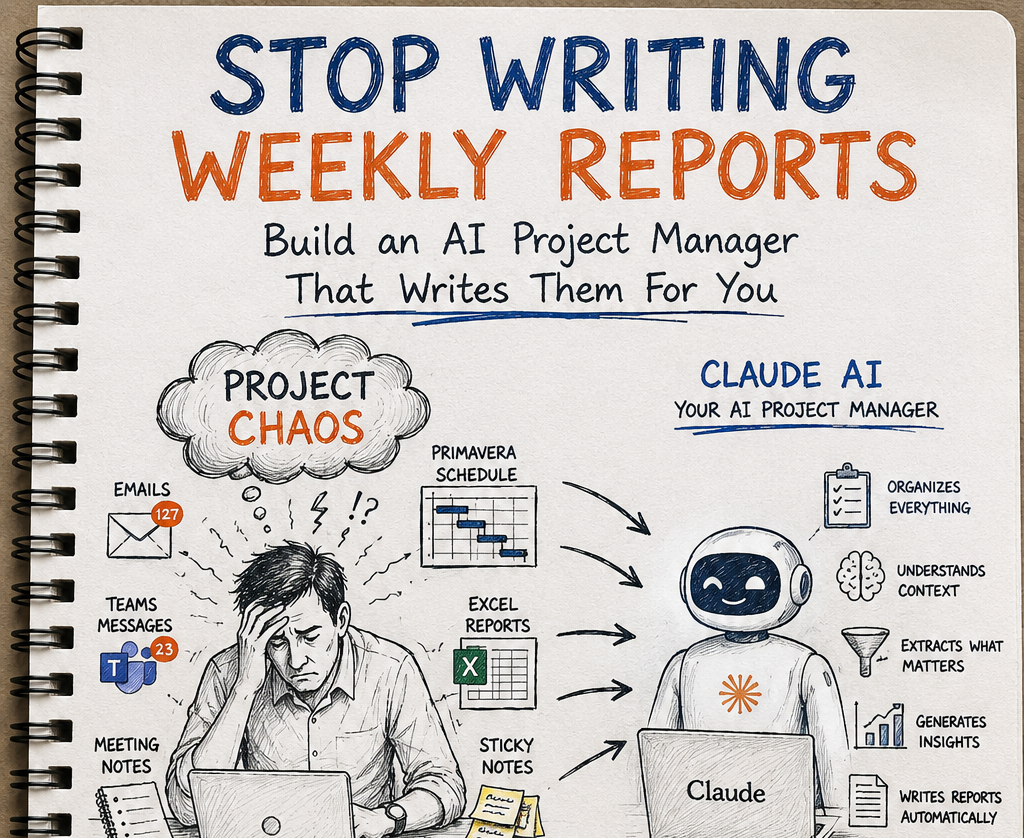
Stop Writing Weekly Reports
A field guide for planners, project controls leads and delivery managers — how to set up an AI project manager that captures the noise as it happens and writes the weekly report for you, so your time goes back into judgement, not formatting.
Read article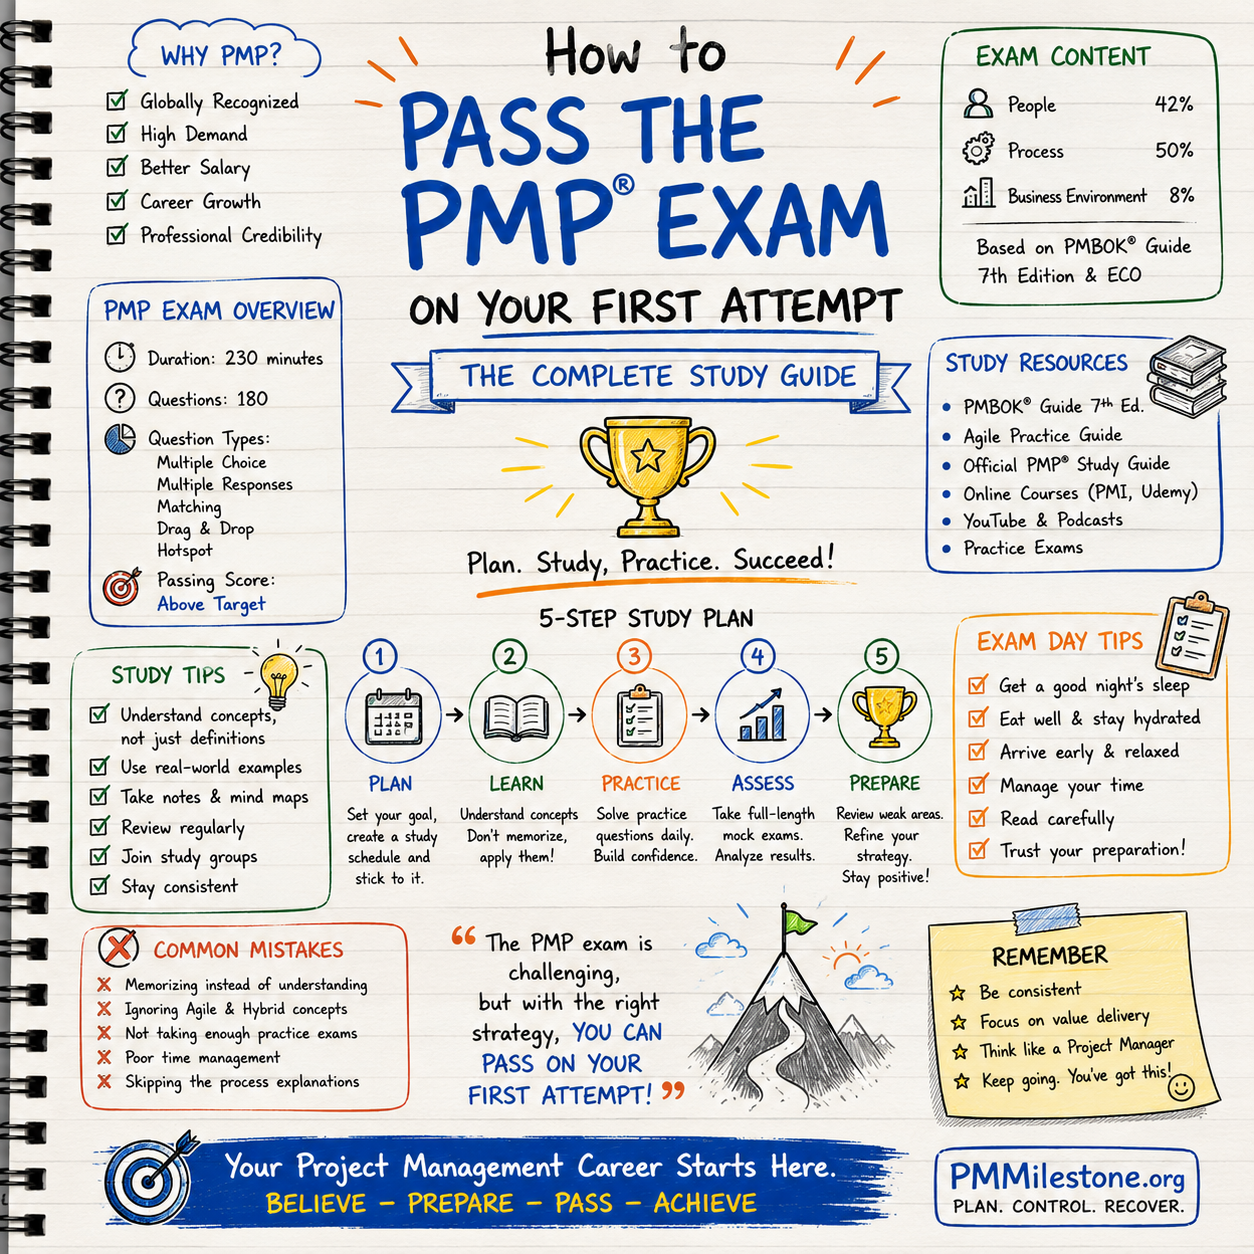
How to Pass the PMP® Exam on Your First Attempt
A complete, practitioner-written PMP study guide — exam format, ECO domain weightings, an 8-week study plan, common mistakes and an exam-day playbook to pass on the first attempt.
Read article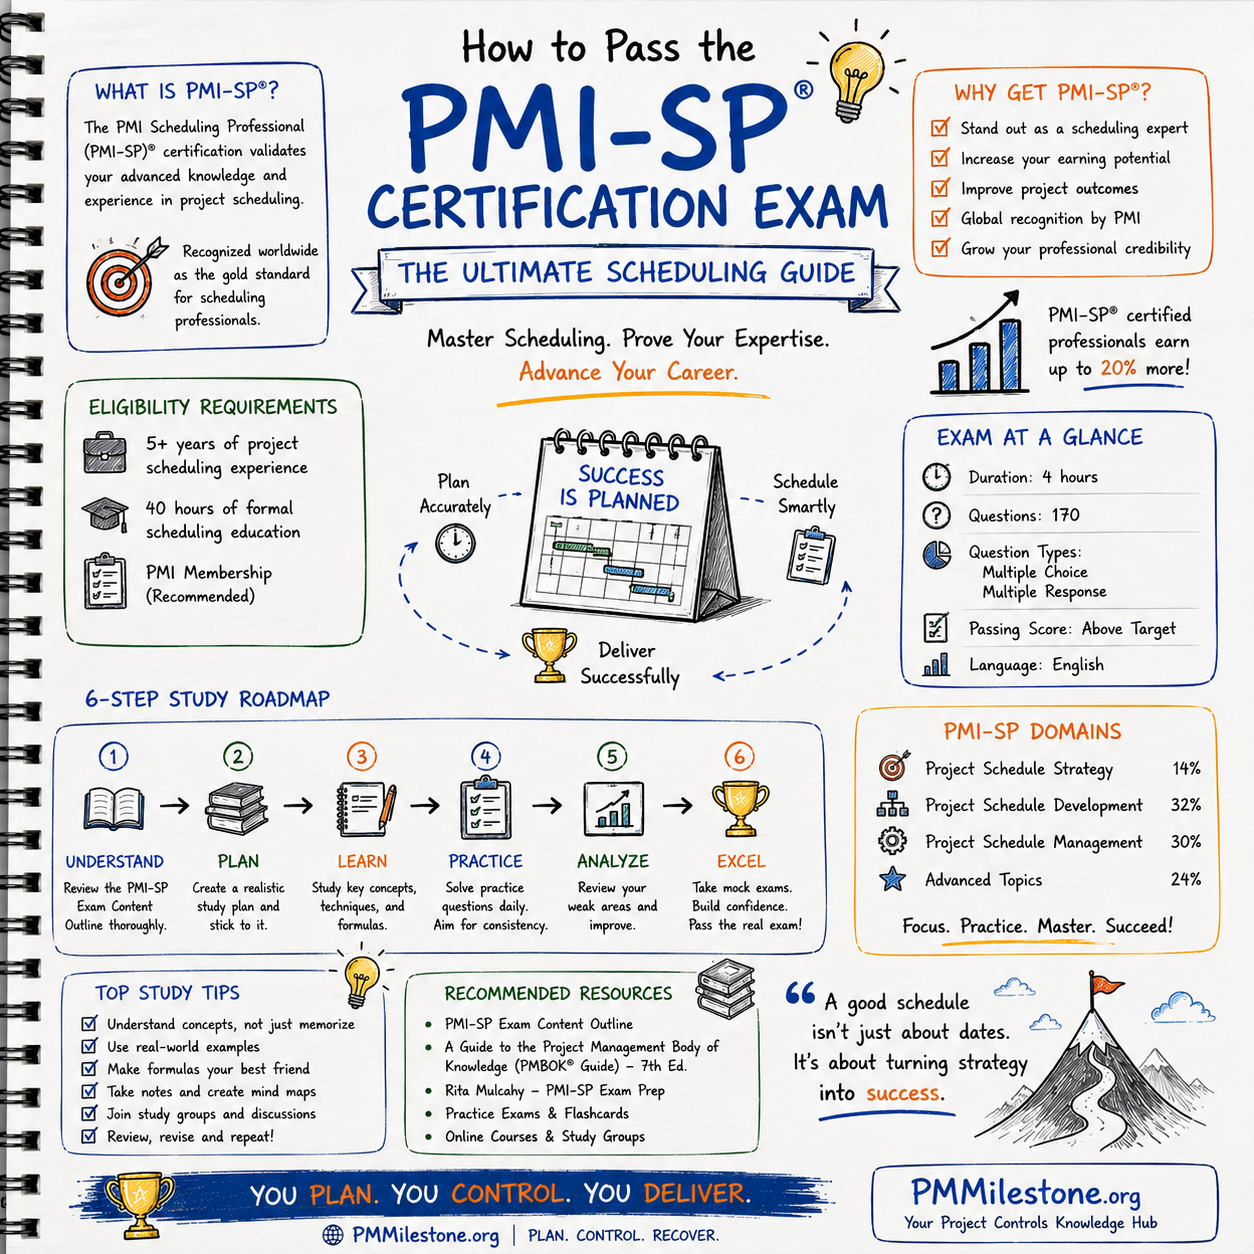
How to Pass the PMI-SP® Certification Exam
A planner-written guide to the PMI-SP credential — real exam format, five-domain weighting from the current ECO, eligibility paths, a ten-week study plan and the formulas worth knowing cold.
Read article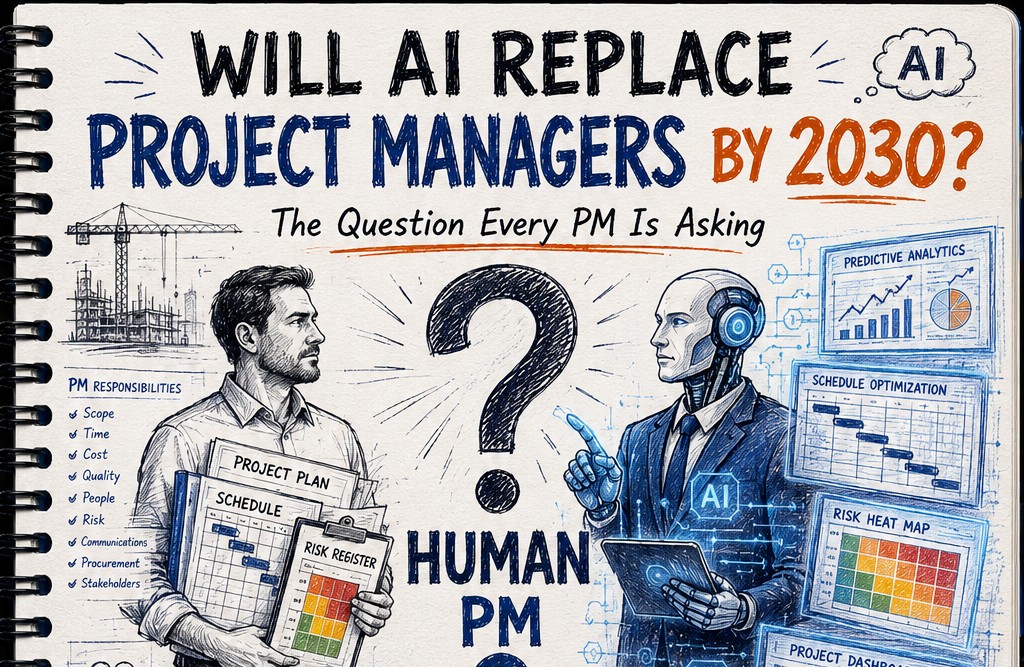
Will AI Replace Project Managers by 2030? A Practical, No-Hype Guide
A practical, no-hype answer to the question every PM is asking — what AI will automate, what it can't replace, and how to make yourself more valuable as the tools improve.
Read article
Project Controls Certification Guide (2026)
PMP, PMI-SP, PMI-RMP, AACE CCP, AACE PSP and EVP compared — choose the right certification path for planning, cost and controls professionals.
Read article
Planning Engineer to Controls Director
A practitioner's career roadmap with skills, certifications and salary at every stage — from junior planner to director of project controls.
Read article
Earned Value Management — Ultimate Guide
PV, EV, AC, CPI, SPI, EAC, TCPI, S-curves and a worked construction example — the definitive EVM reference for project controls practitioners.
Read article
Construction Delay Analysis & EOT Claims
Delay analysis methods, EOT claims, concurrency, prolongation cost and recovery strategies — the full forensic playbook for construction delay disputes.
Read article
When a Strong Team Loses Control — Paraguay vs USA
What can project managers learn from Paraguay's 1–4 loss to USA? Project controls lessons on risk, recovery planning, dashboards, SPI, CPI and leadership — told from the site office.
Read article
Project Controls Leadership Roadmap
A practical leadership roadmap from junior project controls engineer to director, with role-by-role expectations, technical and leadership skill progression, salary examples and long-range development plans.
Read article
Mega Project Learning Path
A practical learning path for understanding how large infrastructure projects are governed, planned, reported and controlled across PMO, schedule, cost, risk and executive decision layers.
Read article
Integrated Project Controls Framework Explained
A complete explanation of the integrated project controls framework: the core disciplines, how the data connects, where integration fails and what mature delivery looks like.
Read article
Project Controls KPIs Explained
A practical KPI guide covering the project controls metrics that actually drive decisions, from SPI and CPI to EAC, VAC, productivity, PMO and executive dashboard KPIs.
Read article
Construction Claims Career Path
A practical roadmap for engineers moving from site delivery into planning, delay analysis, claims, commercial controls and senior claims consulting.
Read article
Project Controls Digital Transformation Roadmap
A future-focused guide to modern project controls through data integration, reporting automation, Power BI, AI, BIM and digital PMO capability building.
Read article
Construction Claims Management Framework Explained
A practical claims management framework for construction and infrastructure projects covering entitlement, records, analysis, negotiation and governance.
Read articleKnowledge pillars across the Academy
Deep-dive pillar articles covering EVM, delay analysis, scheduling, risk and project controls — refreshed on every visit.
Construction Claims Management Framework Explained
A practical claims management framework for construction and infrastructure projects covering entitlement, records, analysis, negotiation and governance.
Read pillar
PMO Reporting Framework
A reference guide to executive PMO reporting covering dashboard structure, KPI choice, portfolio views, reporting cadence and common reporting mistakes.
Read pillar
Guides and Long-Form Articles
Practitioner-written explainers across EVM, planning, forecasting, risk and PMO design — read as a syllabus or as a refresher.
Read pillar
Q&A and Exam-Style Questions
Concept questions in the style of PMP / PMI examinations, plus practical scenarios from real construction and PMO environments.
Read pillar
Interactive Calculators
More than thirty client-side calculators covering EVM, schedule, risk, construction productivity, contingency, PMO maturity and career planning.
Read pillar
Case Studies and Insights
Auto-synced articles from PMMilestone Intelligence Center bring fresh case studies, failure patterns and project-intelligence commentary into the Academy.
Read pillar
The Complete Construction Delay Analysis Guide
A complete, practitioner-led walkthrough of construction delay analysis: delay categories, methodologies, claims preparation and mitigation strategies for real EPC and building projects.
Read pillar
Project Controls Dashboard Design Masterclass
How to design project controls dashboards that drive real decisions — KPI selection, EVM visualisation, risk indicators, layout patterns and the most common dashboard mistakes.
Read pillar
The Complete Guide to Project Forecasting
How professional project controls teams forecast cost, schedule, productivity and cash flow — and how to combine them into a single risk-adjusted view a board can act on.
Read pillar
Construction Productivity Management
How to measure, benchmark and improve construction productivity at crew, discipline and project level — and use it as a leading indicator for schedule and cost.
Read pillar
PMO Reporting and Executive Dashboards
How to design PMO reports and executive dashboards that drive decisions instead of just describing status — KPI hierarchies, narrative structure and the cadence that keeps them honest.
Read pillar
Risk Management for Mega Projects
How risk management actually works on mega projects — beyond the register, into quantitative analysis, reserve sizing, risk-adjusted forecasts and structured recovery.
Read pillarUpgrade to Enterprise-Level Project Intelligence
Discover the Elite Project Controls System — a professional intelligence framework for modern project controls, forecasting, executive reporting, AI PM workflows and risk management.
- ★Executive-grade KPI frameworks
- ★AI-powered project workflows
- ★Forecasting & risk intelligence
- ★PMO-ready reporting templates