Case 01 · United Arab Emirates · 2004–2010
Burj Khalifa
Super-tall mixed-use tower (828 m)
Burj Khalifa was conceived as the centrepiece of Downtown Dubai during the city's first wave of trophy-asset urbanism. The owner, Emaar Properties, needed both an architectural symbol and a development engine for the surrounding district. Samsung C&T led the construction joint venture, with Skidmore, Owings & Merrill as designer and Hyder Consulting on structural engineering.
Risks
Vertical construction logistics and supply continuity
Controls actions
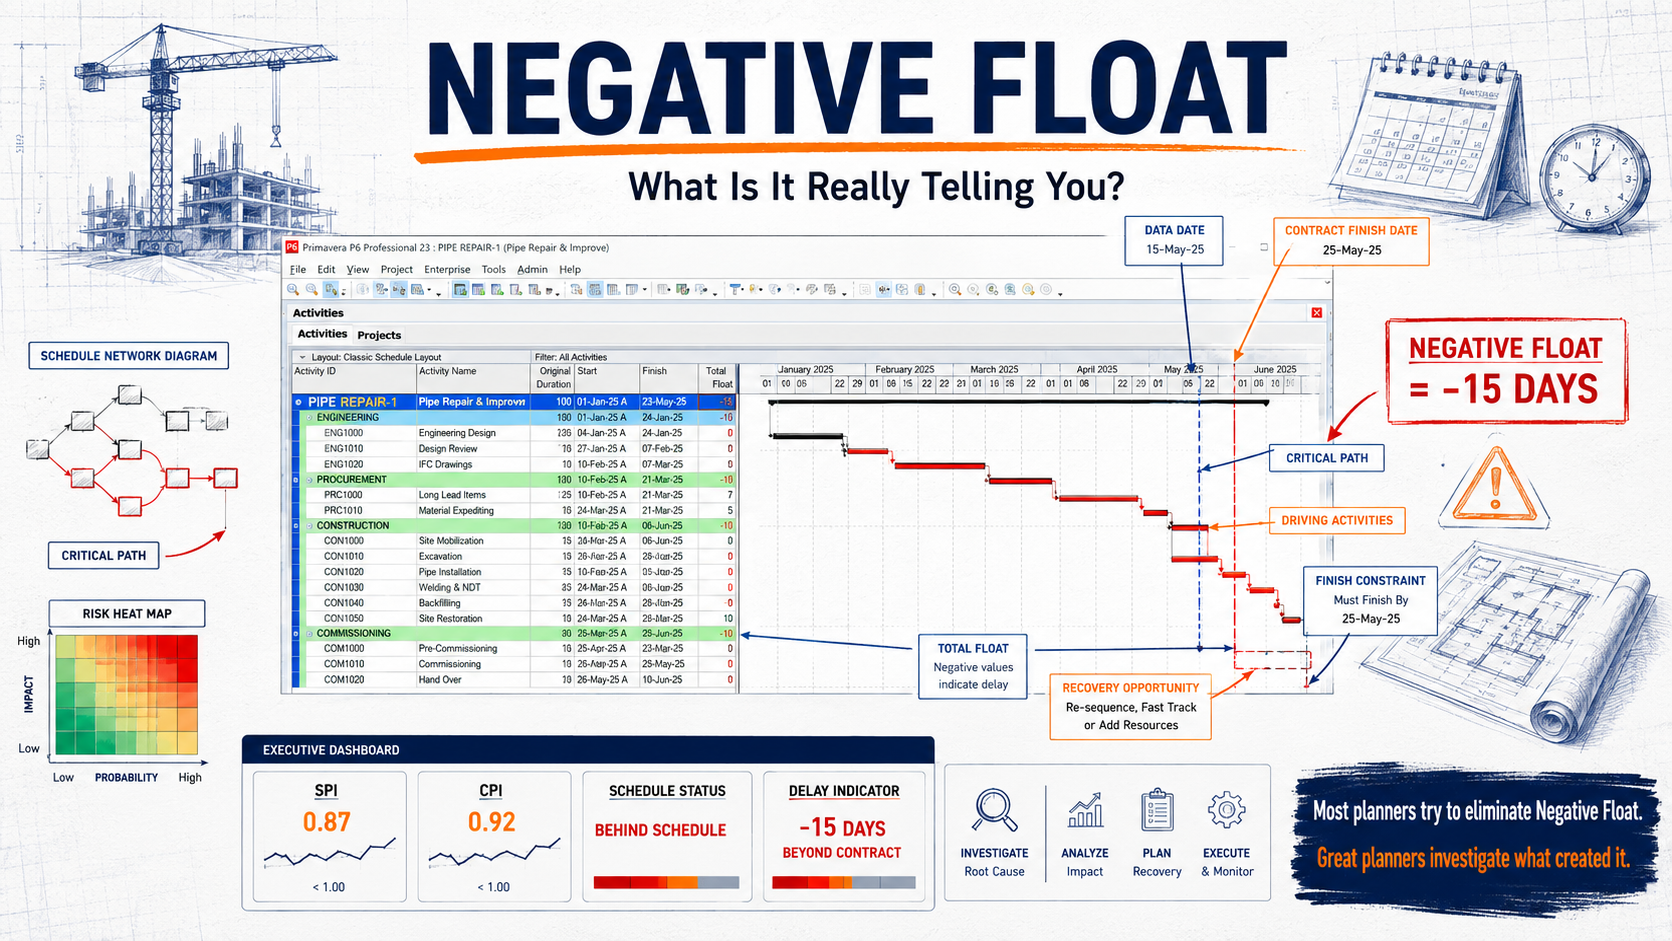
When the critical path is physically located at a single workface (here, the top of the core), all controls reporting must zoom in on that workface. Aggregated S-curves hide the only signal that matters.
Outcome & best practice
Treat the workface, not the overall S-curve, as the unit of control
Toggling views highlights the relevant lenses — no content is hidden.
Planned cost
USD 1.5B (2004)
Reported actual cost
USD 1.5B (2010)
Planned duration
6 yrs
Actual duration
6 yrs
Outcome
Delivered
Planning → Controls → Outcome
Planning
Buttressed-core design resolved pre-bid
Controls action
Workface-level concrete cycle reporting
Recovery / outcome
3-day floor cycle held to topping-out
Planning complexity
The buttressed-core structural system and unprecedented height required wind-tunnel testing, helicopter-assisted concrete pumping research and a custom self-jumping formwork system. Logistics for vertical transport — concrete, steel, people, MEP — were planned almost as a separate sub-project, with hour-by-hour day shifts modelled before excavation began.
Governance model
A relatively flat decision chain between the owner and the joint venture allowed daily issues to be resolved without escalation. Critically, the design team was retained in the field through topping-out, which is unusual on a project of this size and a clear reason coordination stayed tight.
Schedule challenge
Pouring high-strength self-consolidating concrete to record heights — and curing it overnight to maintain a three-day floor cycle — meant the critical path lived at the top of the building. Any disruption to concrete supply rolled directly into the handover programme.
Cost challenge
At roughly USD 1.5 billion in 2010 dollars, Burj Khalifa was delivered close to its 2004 estimate even though scope grew during construction. Owner-led discipline on procurement packages and a stable supply chain insulated the program from the wider 2008 financial shock.
Risk challenge
Wind-induced motion, evacuation strategy and lifecycle façade cleaning were treated as design risks, not just operational ones. The tower's stepped Y-plan was selected partly because it confused vortex shedding — a structural solution that also reduced operational risk later.
Project controls lesson
When the critical path is physically located at a single workface (here, the top of the core), all controls reporting must zoom in on that workface. Aggregated S-curves hide the only signal that matters.
| Phase | Planning milestone | Controls action | Outcome |
|---|---|---|---|
| 2004 | Design largely resolved before contract | Wind-tunnel & jump-form prototypes | Stable scope at bid |
| 2006 | Self-jumping formwork ramped up | Hour-by-hour vertical logistics plan | Sustained 3-day cycle |
| 2008 | Topping-out at 828 m | Daily workface variance review | Critical path defended through GFC |
| 2010 | Opening — Downtown Dubai launch | Punchlist & handover closeout | On budget, on schedule |
- 2004Stable scope at bid
- Milestone
- Design largely resolved before contract
- Controls action
- Wind-tunnel & jump-form prototypes
- 2006Sustained 3-day cycle
- Milestone
- Self-jumping formwork ramped up
- Controls action
- Hour-by-hour vertical logistics plan
- 2008Critical path defended through GFC
- Milestone
- Topping-out at 828 m
- Controls action
- Daily workface variance review
- 2010On budget, on schedule
- Milestone
- Opening — Downtown Dubai launch
- Controls action
- Punchlist & handover closeout
Key takeaway for PMs
Symbolic projects can still be delivered to plan when the owner protects the designer, the supply chain is locked early and the controls function reports against the real, physically visible critical path.
Practitioner FAQ — Burj Khalifa
Why did Burj Khalifa stay close to its original cost estimate?
Scope was largely resolved before contract award, the supply chain was locked early, and owner-led procurement discipline kept package prices stable even through the 2008 financial shock.
What is the single most transferable controls lesson from Burj Khalifa?
Report against the physical workface where the critical path actually lives — in this case the top of the core — rather than aggregated S-curves that hide the only signal that matters.
How can a smaller project apply the Burj Khalifa workface discipline?
Identify the one location (a riser, a cutover window, a regulatory submission) where the critical path physically sits, and require daily variance reporting on that workface only.