Project Controls Digital Transformation Roadmap


Why digital transformation in project controls is really about decision quality
Project controls teams rarely struggle because they have no data. They struggle because the data is fragmented, late, inconsistent or disconnected from the decision that matters. One report shows cost. Another shows schedule. A third shows risk. None tells the project director what to do next. That is the real problem digital transformation is meant to solve.
When digital transformation is described only as a technology upgrade, teams often purchase tools faster than they improve governance. The result is a more colourful version of the same reporting chaos. Mature organisations approach it differently. They begin by identifying the critical decisions: reforecasting, executive escalation, change approval, recovery prioritisation, portfolio allocation. Then they build the data flows, reporting logic and ownership around those decisions.
The best digital controls environments therefore feel simpler, not more complicated. Data enters once, is validated consistently, and then serves multiple outputs: dashboards, trend analysis, risk views, forecast packs and management commentary. That is the transformation worth paying for.
Stage 1 — Digitize and standardize before you automate anything
The first stage is usually unglamorous. Teams digitize source records, standardize codes, align WBS structures, define reporting cut-offs and remove duplicated manual files. This stage is where many leaders lose patience because the results are not yet visually impressive. But without it, every later dashboard simply automates inconsistency.
In project controls, standardization means more than having one template. It means the schedule WBS, cost codes, risk categories, issue logs and progress rules can speak to each other. If one package is called 'Area 4 Civil' in the schedule, 'CIV-A4' in cost and 'Civil Works West' in risk, the integration layer becomes a permanent repair job. That is not transformation; it is data firefighting.
A practical sign that stage one is healthy is when monthly reporting no longer depends on one heroic analyst manually reconciling everything the night before the steering committee. If the system still relies on heroics, the foundation is not ready.
Stage 2 — Connect systems so schedule, cost and risk stop living in silos
Once core structures are stable, the next goal is integration. In many PMOs this means connecting Primavera P6 or another scheduling platform with cost systems, document platforms, issue logs and BI layers such as Power BI. The value is not that the systems talk to each other in principle; it is that the same portfolio pack can now show schedule drift, cost exposure and key risk movements in one narrative.
Integration should be selective rather than maximalist. Not every field belongs in the dashboard layer. Teams that try to connect everything often create fragile pipelines no one trusts. Instead, connect the fields that directly drive controls decisions: baseline dates, actual dates, forecast dates, committed cost, actual cost, forecast cost, risk exposure, issue aging, resource loading and governance status.
This is also the point where reporting automation begins to earn its keep. When portfolio summaries, exception views and weekly PMO packs populate automatically from the same governed sources, the controls team can spend more time explaining trends and less time assembling slides.
Digital PMO data flow
Schedules, costs, risks, issues, procurement, resources
Common IDs, WBS, calendars, reporting logic
Power BI dashboards, KPI packs, portfolio views
Recovery actions, escalations, forecast resets, approvals
Power BI and dashboard automation: useful when the KPI logic is mature
Power BI has become a common front end for project controls transformation because it is flexible, comparatively accessible and strong at portfolio-scale visualization. But Power BI is only as good as the business logic sitting underneath it. If SPI, CPI, EAC, risk thresholds or milestone definitions are inconsistent, the dashboard will display inconsistency at scale.
The most effective PMOs treat dashboard design as an editorial discipline. They limit executive screens to decision-driving KPIs, reserve detailed drill-down for managers who need it, and keep measure definitions stable over time. A dashboard should answer what changed, why it changed and what decision is required. If it merely presents more charts, it has increased attention demand without increasing clarity.
Automation is valuable here because it improves cadence and trust. Weekly status packs, executive scorecards and PMO health summaries become more credible when they are refreshed consistently from defined rules instead of being rebuilt manually every cycle.
AI applications in project controls: real use cases versus hype
AI can help project controls, but only in bounded areas. It is genuinely useful for anomaly detection across reporting histories, drafting schedule narratives, summarizing risk-register changes, spotting outliers in portfolio KPI movement and helping teams interrogate large document sets. These are productivity uses, not replacements for professional judgment.
Where AI struggles is where ambiguity, commercial sensitivity and contractual interpretation dominate. It does not own the baseline. It cannot decide concurrency in a delay claim. It should not set contingency strategy without a human owner. Mature teams therefore use AI as a co-pilot after governance has matured, not as a shortcut around governance.
A sensible digital roadmap places AI after data quality and reporting logic are already stable. Otherwise the organisation simply accelerates low-quality conclusions. The phrase to remember is simple: bad data plus faster processing is still bad management.
Digital twins, BIM and integrated delivery information
For project controls teams in major building and infrastructure environments, BIM and digital twin capability create the possibility of a richer link between model, schedule, cost and performance. In practical terms, that means 4D schedule visualization, quantity-linked progress analysis, scenario testing and better visibility of where workface readiness is lagging. Used well, this reduces the translation gap between field conditions and executive reporting.
But BIM integration only helps controls when the model governance is disciplined. If naming conventions are loose, status updates are irregular or field progress is not aligned to model objects, the integration becomes visually impressive but analytically weak. The lesson is the same as everywhere else in transformation: clarity before sophistication.
Digital twins are most useful when they support specific operational questions such as sequence feasibility, handover readiness, maintenance visibility or asset performance. They are least useful when deployed as a prestige layer detached from live controls routines.
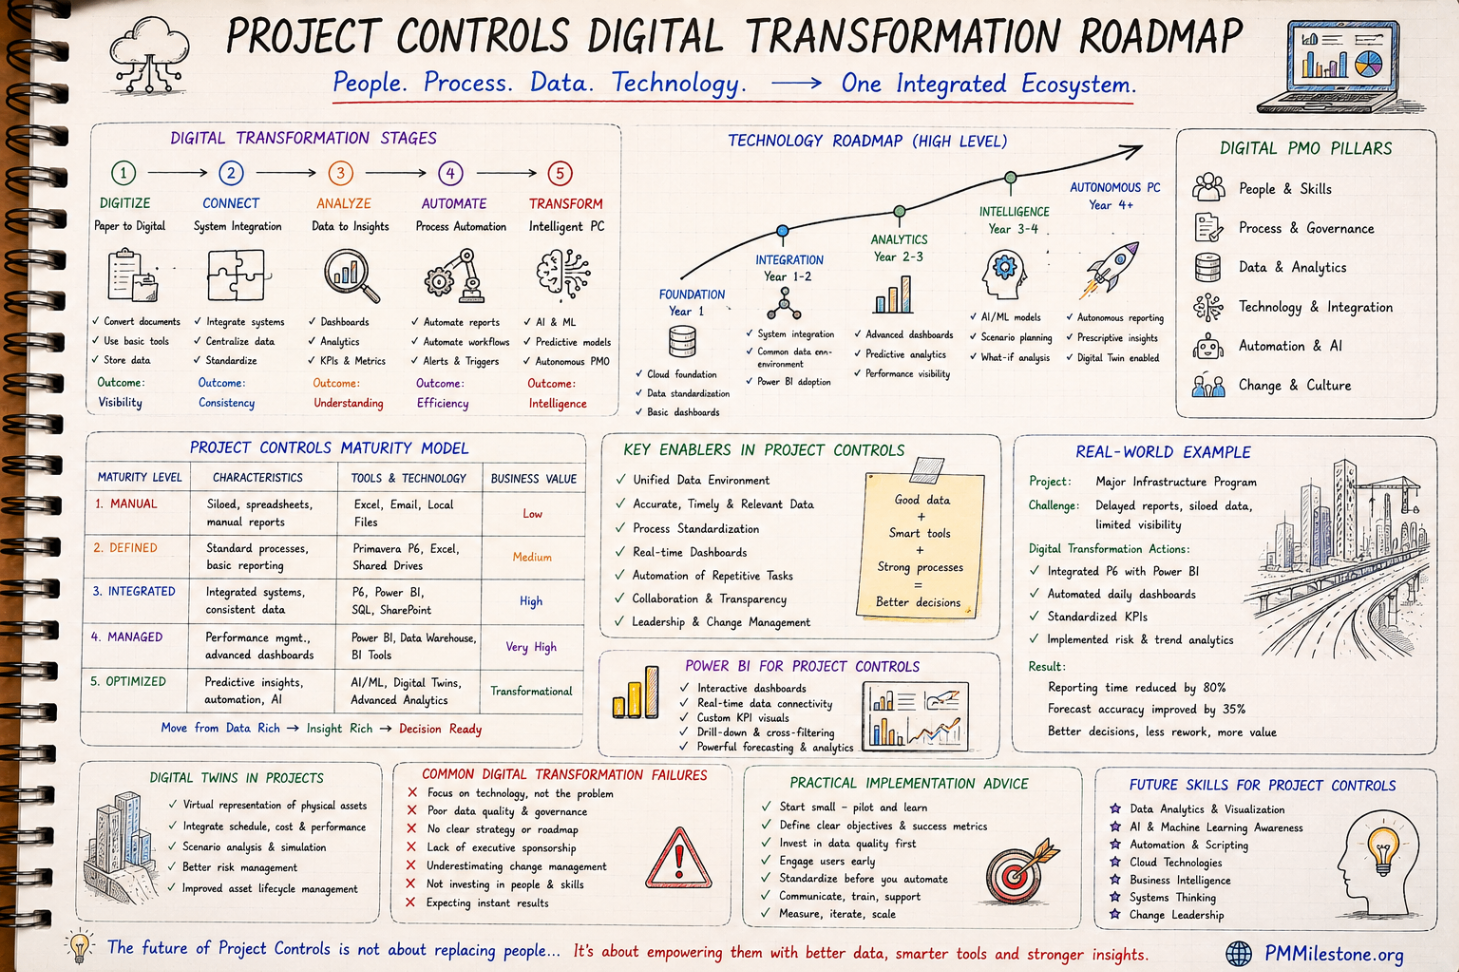
A practical maturity model for digital project controls
A simple maturity model helps leaders sequence investment sensibly. At the manual stage, reporting is spreadsheet-driven, definitions vary by project and forecast quality depends on analyst effort. At the defined stage, core templates, codes and reporting rhythms are standardized. At the integrated stage, schedule, cost and risk flow through shared structures. At the managed stage, dashboards and automation reduce reporting friction. At the optimized stage, predictive analytics, scenario testing and AI support better decisions without undermining human accountability.
The key is to diagnose honestly. Many organisations describe themselves as advanced because they own reporting software, when in reality they are still at the manual or defined stage because their underlying data discipline is weak. Honest maturity assessment is uncomfortable, but it prevents expensive theatre.
This is where tools such as the PM Health Score, PM Maturity Assessment, Portfolio Health Index and executive KPI dashboard become useful not just as metrics but as transformation checkpoints. They show whether the PMO is becoming more decision-ready, not just more digitized.
Project controls maturity model
Spreadsheet-driven, siloed reporting
Templates, standards, clear cut-offs
Shared data model across schedule, cost and risk
Automated dashboards and exception-based reporting
Predictive insight with human-led governance
Common digital transformation failures — and why they repeat
The first repeating failure is technology-first thinking. Teams buy tools before defining ownership, KPI logic or reporting standards. The second is underestimating data quality work. Leaders are often surprised by how much of the programme is really a coding, reconciliation and governance exercise. The third is weak sponsorship. If executives want better dashboards but do not insist on better source discipline from project teams, the transformation stalls.
Another common failure is trying to transform everything at once. Mature PMOs phase the roadmap. They start with the management pack, the executive dashboard or the portfolio health view, prove usefulness, and then expand. That creates trust and momentum. By contrast, big-bang transformation often produces long implementation cycles with little visible value, which kills credibility before behaviour changes.
The final failure is forgetting the user. Controls analysts, project managers and executives do not need the same screen. A well-designed digital PMO serves each audience differently while preserving one underlying truth set.
Future skills for project controls professionals
The future project controls professional still needs the traditional core: planning logic, earned value, forecast discipline, risk thinking and reporting judgment. Digital transformation adds a second layer of capability on top of that foundation. Professionals increasingly benefit from data literacy, dashboard design awareness, Power BI fluency, basic data modelling, automation thinking and a healthy skepticism toward AI outputs.
The most valuable future skill, however, is translation. Senior professionals must be able to translate between project teams, executives, data engineers and technology vendors. They need to explain why a KPI matters, why a field must be governed, why an integration is worth funding and why a predictive model cannot be trusted yet. That is not a software skill. It is leadership built on technical understanding.
Professionals who develop both controls depth and digital literacy will be disproportionately valuable because they can modernize systems without breaking confidence in the numbers. That is exactly what real PMOs need.
Frequently asked questions
What is the first step in project controls digital transformation?
Usually it is standardizing data structures, reporting cut-offs and ownership before any major automation effort. Without that foundation, dashboards simply scale inconsistency.
Is Power BI enough to transform a PMO?
No. Power BI is a strong visualization layer, but transformation depends on underlying KPI logic, data governance, integration discipline and user adoption. The tool alone cannot create trust in the numbers.
Where does AI fit in a digital project controls roadmap?
After core data quality and reporting logic are stable. AI is useful for summarization, anomaly detection and pattern support, but it should not replace human judgment on baselines, claims or commercial decisions.
How do digital twins and BIM help project controls teams?
They can improve visibility of sequence, quantities, readiness and scenario testing when model governance is strong. They add less value when deployed as visual layers without disciplined project data behind them.
What future skills matter most for project controls professionals?
Data literacy, dashboard and BI fluency, automation awareness, and the ability to translate between project delivery teams, executives and technology teams — while preserving strong fundamentals in planning, cost, risk and reporting.
Related learning for this topic
Hand-picked Learning Tracks, Knowledge Pillars, publications and case data that extend this article.
Next steps on PMMilestone
Use these pages to deepen the topic, verify terminology, compare real cases and move from theory into applied project controls practice.
Related calculators
Open the calculators referenced in this article and run them against your own project numbers.
PM Maturity Assessment
Score PM maturity across 5 dimensions.
Open ReportingExecutive KPI Dashboard
Single executive KPI score 0–100.
Open ReportingPortfolio Health Index
Roll-up score of portfolio performance.
Open ReportingPM Health Score
Composite project health score 0–100.
Open RiskRisk Exposure Calculator
Quantify Expected Monetary Value of a risk.
OpenOther learning tracks

Construction Claims Career Path
A practical roadmap for engineers moving from site delivery into planning, delay analysis, claims, commercial controls and senior claims consulting.
Project Controls Fundamentals
Scope, schedule, cost, risk, quality and reporting — the six disciplines that hold every successful capital project together, taught from first principles.
Earned Value Management
From PV / EV / AC to SPI, CPI, EAC, ETC, VAC and TCPI — the full toolkit for measuring and forecasting project performance.