Earned Value Management (EVM): The Ultimate Guide
PV · EV · AC · CPI · SPI · Forecasts that survive an audit — for construction & infrastructure

Earned value management has a reputation problem. To many site teams it sounds like an accountant's ritual — three letters, a formula sheet, and a report nobody reads. That is a shame, because when it is done honestly EVM is the single most powerful early-warning system a project has. It is the only technique that tells you, in one integrated picture, whether you are getting the work you have paid for and whether you will finish on time and on budget.
The one idea behind earned value
Strip away the acronyms and EVM rests on a single, almost obvious insight: to know how a project is really doing, you have to compare three things, not two. Most projects only compare two — how much they planned to spend against how much they actually spent. That comparison is dangerously misleading, because spending less than planned might mean you are efficient, or it might mean you have done almost no work.
That third number is earned value, and adding it changes everything. Suddenly you can separate two questions that the old plan-versus-actual comparison hopelessly tangled together: are we behind schedule, and are we over budget? A project can be one, both, or neither — and the response to each is completely different.
| Term | Plain meaning | Also known as |
|---|---|---|
| PV — Planned Value | Budgeted cost of the work you planned to have done by now | BCWS |
| EV — Earned Value | Budgeted cost of the work you have actually done | BCWP |
| AC — Actual Cost | What you have actually spent doing it | ACWP |
| BAC — Budget at Completion | The total approved budget for all the work | — |
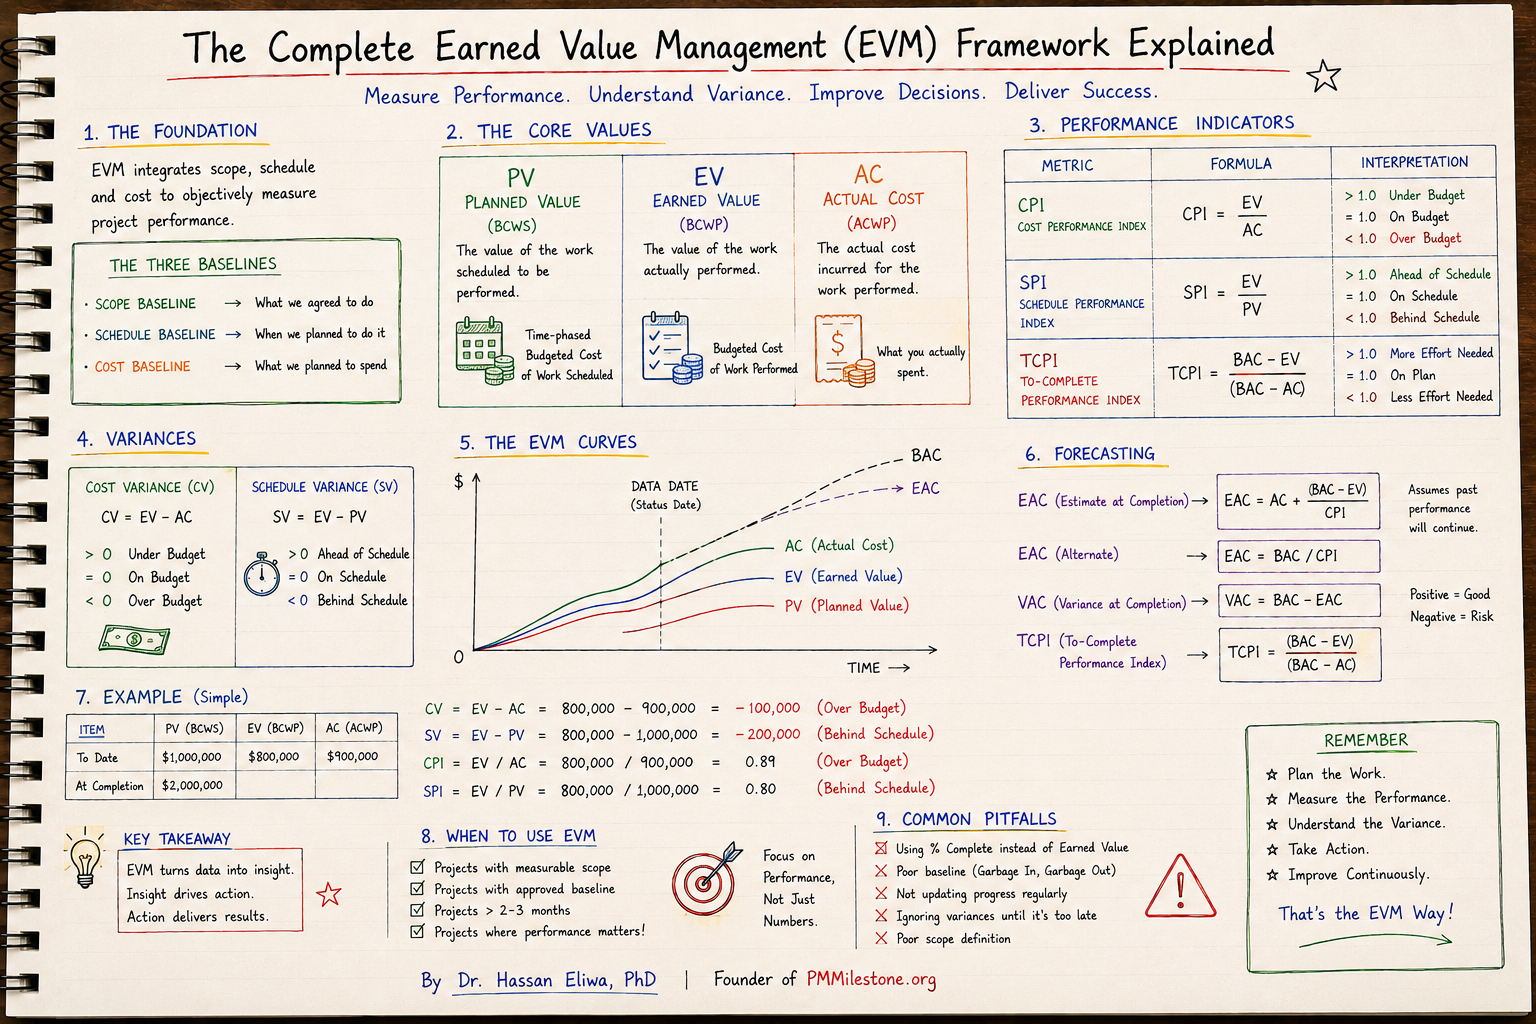
Reading the S-curve
The S-curve is where EVM comes alive. Plot PV, EV and AC cumulatively against time and the gaps between the three lines tell the project's story at a glance. The horizontal or vertical distance between EV and PV is your schedule variance — are you ahead of or behind the plan? The distance between EV and AC is your cost variance — is the work costing more or less than budgeted?
The formulas you actually need
EVM has a long formula sheet, but a working practitioner relies on a small core. Learn these six and you can run earned value on almost any project.
| Metric | Formula | How to read it |
|---|---|---|
| Schedule Variance (SV) | EV − PV | Negative = behind schedule |
| Cost Variance (CV) | EV − AC | Negative = over budget |
| Schedule Performance Index (SPI) | EV ÷ PV | Below 1.0 = behind schedule |
| Cost Performance Index (CPI) | EV ÷ AC | Below 1.0 = over budget |
| Estimate at Completion (EAC) | BAC ÷ CPI | Forecast final cost at current efficiency |
| To-Complete Performance Index (TCPI) | (BAC − EV) ÷ (BAC − AC) | Efficiency needed to still hit budget |
CPI and SPI are the heartbeat of EVM. Both are simple efficiency ratios where 1.0 means exactly on plan. A CPI of 0.90 means you are getting ninety cents of value for every dollar spent. An SPI of 0.90 means you are achieving ninety percent of the progress you planned. Run live numbers through our CPI calculator, SPI calculator and EAC calculator.
A worked example
Imagine a pipeline renewal package with a budget of one million dollars over ten months. At the six-month data date, the plan said we should have completed sixty percent of the work. In reality, progress measurement shows we have genuinely completed fifty percent, and the cost ledger shows we have spent five hundred and sixty thousand dollars.
| Input | Value | Where it comes from |
|---|---|---|
| PV (Planned Value) | $600,000 | 60% × $1.0m planned at data date |
| EV (Earned Value) | $500,000 | 50% × $1.0m actually complete |
| AC (Actual Cost) | $560,000 | Cost ledger to date |
| BAC | $1,000,000 | Total package budget |
| Result | Value | Interpretation |
|---|---|---|
| SV | −$100,000 | Behind schedule |
| CV | −$60,000 | Over budget |
| SPI | 0.83 | 17% slower than plan |
| CPI | 0.89 | 11% over budget per dollar earned |
| EAC | $1,123,596 | Forecast cost if current CPI holds |
| TCPI (to hit BAC) | 1.14 | Would require 14% better efficiency than planned |
CPI and SPI together: the performance quadrant
Looked at individually, CPI and SPI each tell half a story. Plotted together they tell the whole one. A project that is behind but under budget needs acceleration; one that is over budget but ahead needs cost discipline; one that is behind and over is in genuine trouble and needs a recovery plan.
Ahead and under budget. Protect it; bank the contingency.
Cost-disciplined but slow. Accelerate the critical path.
Fast but expensive. Tighten cost control; check rates and waste.
Behind and over budget. Recovery plan; escalate; reforecast.
Making EVM work in practice
The mathematics is the easy part. The reason EVM fails on real projects is almost never the formulas — it is the data feeding them. A handful of disciplines separate earned value that earns its keep from earned value that becomes a quarterly fiction: a resource-loaded baseline, an agreed progress rule, a single cut-off date for cost and schedule, and reporting the story behind the numbers rather than the numbers alone.
Frequently Asked Questions
What is the difference between CPI and SPI?
CPI measures how efficiently you are converting money into completed work — earned value divided by actual cost. SPI measures how efficiently you are converting time into completed work — earned value divided by planned value. Both use 1.0 as the on-plan benchmark; below 1.0 signals a problem.
Can earned value management work without expensive software?
Yes. The mathematics runs perfectly well in a spreadsheet for a single project or package. Dedicated tools earn their keep on large, multi-project programmes, but the discipline matters far more than the software.
How do I measure earned value for partially complete activities?
Agree a progress rule before work starts — physical units complete, weighted milestones, or a conservative 0/100 rule where an activity earns nothing until it is fully done. The key is choosing up front and applying consistently.
Why is SPI sometimes considered unreliable near the end of a project?
SPI is based on cost-budget values, not time. Near completion the earned value inevitably converges on the planned value and SPI drifts back toward 1.0 even if the work is finishing late. Use critical-path analysis as the real timing test in the final phase.
Related guides on PMMilestone
Continue your reading with closely related Academy guides and references.
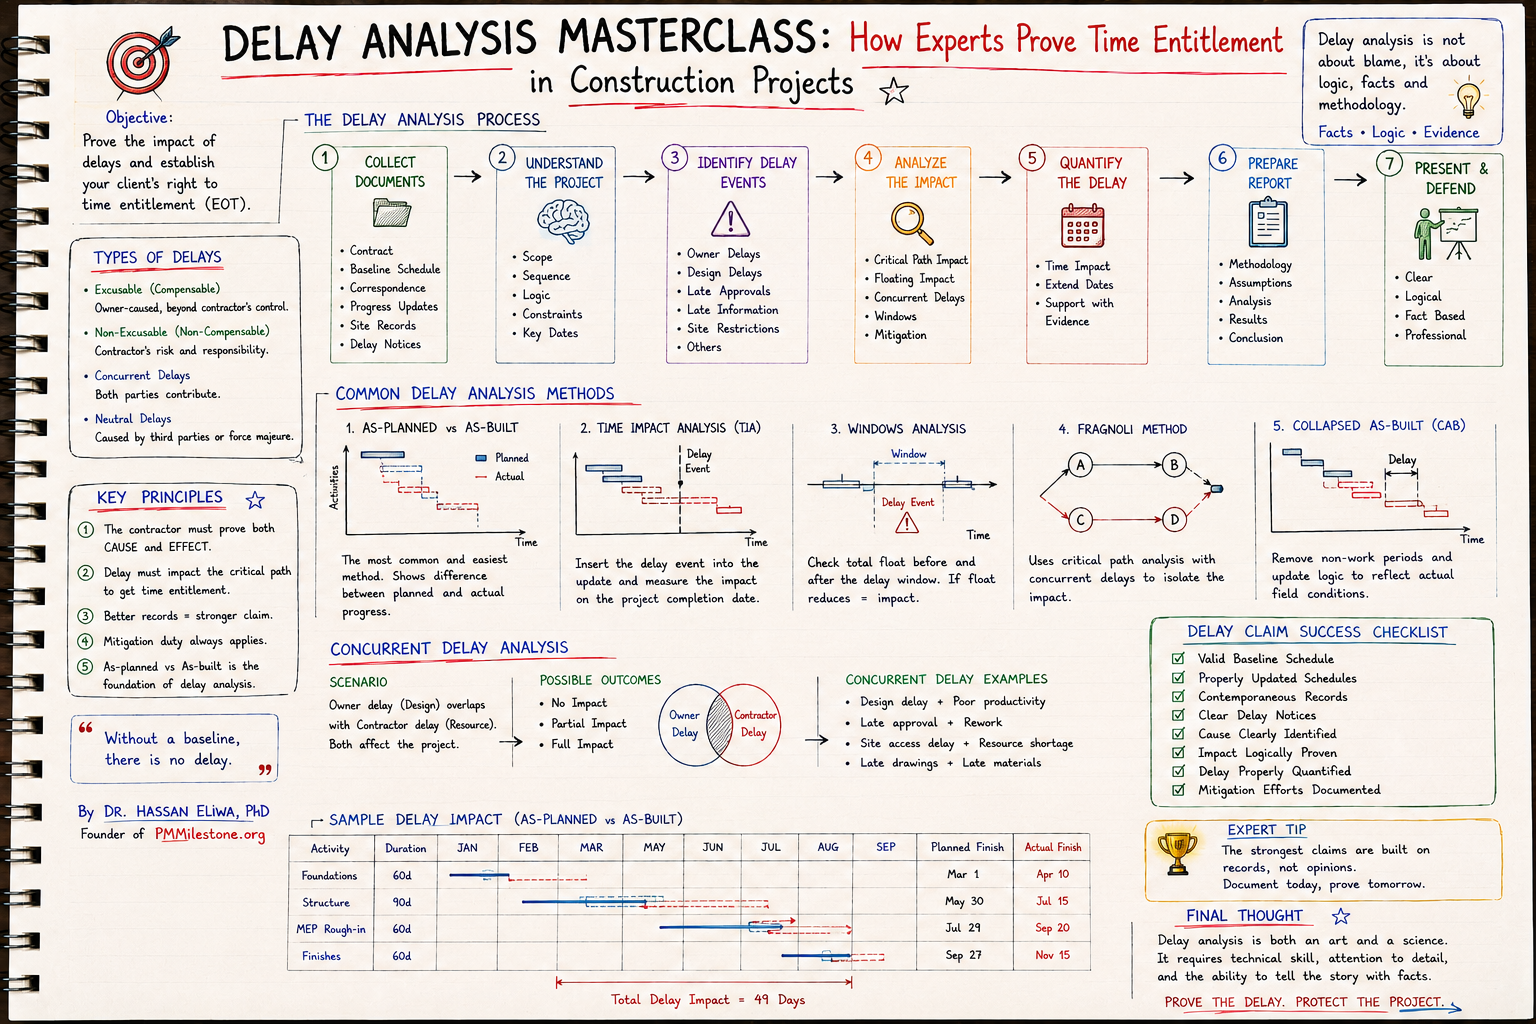
- Knowledge pillarConstruction Delay Analysis, EOTs & RecoveryFive forensic methods, concurrency, prolongation cost and recovery playbook for construction disputes.Open
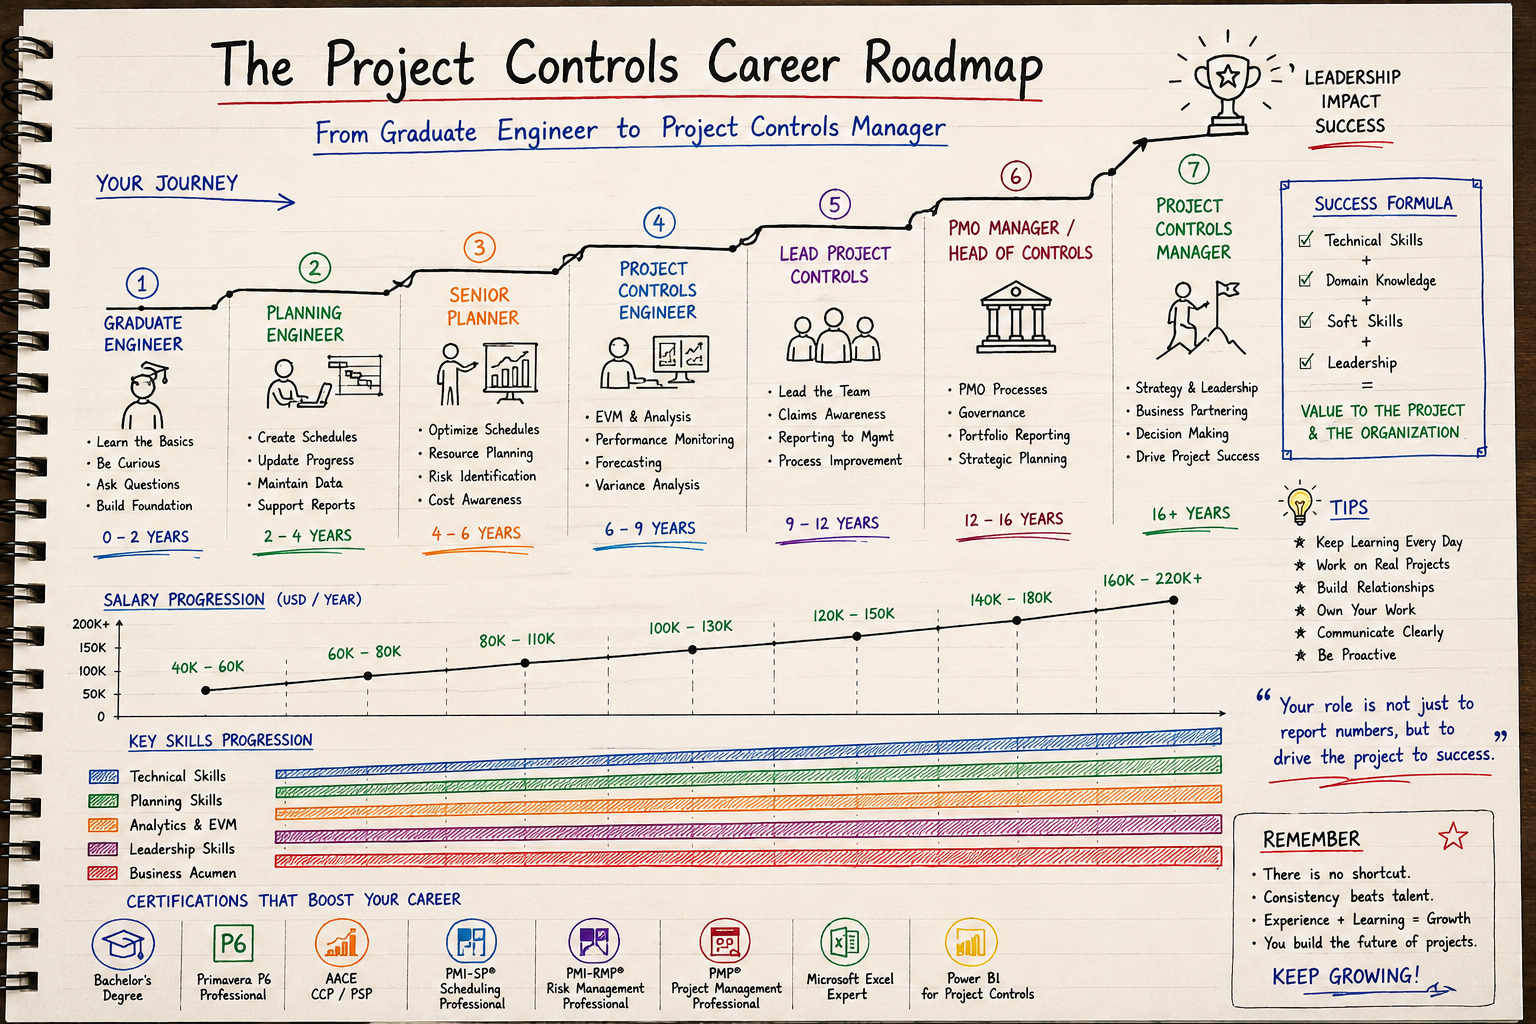
- Learning trackComplete Project Controls Certification Guide (2026)PMP, PMI-SP, PMI-RMP, CCP, PSP and EVP compared side by side for planning and cost professionals.Open
- Learning trackFrom Planning Engineer to Project Controls DirectorCareer roadmap with skills, certifications and salary at every stage from junior planner to director.Open
- HubAcademy — Knowledge pillars hubAll Academy knowledge pillars — the deep references behind the calculators.Open
Related resources
Hand-picked tools, glossary entries, case studies and Academy pages to deepen this topic — curated by Dr. Hassan Eliwa, PhD.
Relevant calculators
Learning tracks
Knowledge pillars
Reference & glossary
Case studies & failures
Author & authority
- Founder — Dr. Hassan Eliwa, PhD
- About PMMilestone.org
- Publications by Dr. Hassan Eliwa
- Reviewed & maintained by the PMMilestone editorial team