Optimistic baseline syndrome
Baselines built on best-case durations and zero contingency. Watch SPI drift below 0.95 within the first 15% of the schedule — that is the leading indicator.
Open related calculatorOriginal, practitioner-written project controls intelligence — failure patterns, mega-project lessons, delay-claims reference, recovery playbooks, PMO dashboards, scheduling, EVM and AI. Every section links to the calculators and Academy pages that turn the idea into a decision.
Last updated · Reviewed by Dr. Hassan Eliwa, PhD
Eight focused resources that sit beside the calculators — case libraries, claims references, recovery playbooks and the dashboard gallery practitioners actually use on live projects.
Searchable record of major project failures, the drivers behind each one and the lessons that changed how the next project was run.
Open database Case studiesLong-form practitioner write-ups of the planning, controls and recovery decisions on the world's most complex programmes.
Read case studies Delay & claimsReference notes on extension of time, concurrent delay, disruption and the documentation that makes a claim defensible.
Open library RecoveryStep-by-step playbooks for diagnosing, replanning and recovering delayed construction and engineering projects.
Open playbooks DashboardsAnnotated executive, EVM, risk, delay, cost forecast and weekly controls dashboards — what to put on each page and why.
View gallery AcademyStructured learning tracks across planning, EVM, risk, PMO and construction controls — written by practising engineers.
Open the Academy CalculatorsFree, no-sign-up calculators for EVM, forecasting, schedule, risk and construction productivity — all client-side.
Browse all tools DiagnosticA short diagnostic that scores schedule, cost, risk and governance signals to flag projects worth a closer look.
Take the quiz01 — Failure Database
A curated catalogue of the recurring failure patterns we see on real programs — scope ambiguity, broken float, optimistic baselines, weak change control and unmanaged interfaces. Each entry is written from a practitioner lens: what failed, why the controls did not catch it, and which calculator on PMMilestone surfaces the same signal early.
Open the full Project Failure Database (15 mega-project case studies)Baselines built on best-case durations and zero contingency. Watch SPI drift below 0.95 within the first 15% of the schedule — that is the leading indicator.
Open related calculatorTotal float quietly evaporates across the critical path while RAG dashboards stay green. Re-run float analysis monthly, not quarterly.
Open related calculatorCPI < 0.9 for three reporting cycles but the EAC is still the original baseline. Force a re-forecast the moment CPI breaches the threshold.
Open related calculatorField instructions issued without variation orders. The cumulative impact is invisible until claims arrive twelve months later.
Open related calculator02 — Mega Projects
Pattern-level studies of large infrastructure, energy and construction programs. We do not republish journalism — we extract the controls lesson: how the schedule baseline was set, how interfaces were managed, and which leading indicators were ignored. Use these as briefing material for steering committees and PMO inductions.
Why progress curves on tunnelling projects rarely follow the S-curve, and how to set realistic productivity assumptions for TBM advance rates.
Open related calculatorInterface management between EPC contractors, vendor packages and commissioning teams — the single largest source of schedule slip on capital projects.
Open related calculatorPolitical deadlines, fixed opening dates and the cost of schedule compression. When acceleration costs exceed liquidated damages, the math has already failed.
Open related calculatorHow portfolio-level health indices expose which sub-projects are dragging the whole program down before the executive committee sees the slip.
Open related calculator03 — Delay Claims
Reference material on prospective and retrospective delay analysis methods — time impact analysis, as-planned versus as-built, windows analysis and collapsed as-built. Each entry summarises when the method is defensible, what records you need to keep from day one, and how to quantify cost impact alongside time.
Prospective method. Insert the delay fragnet into the contemporaneous schedule and re-run CPM. Defensible when contemporaneous schedules were properly updated.
Open related calculatorTwo concurrent delays — one owner, one contractor. How concurrency is treated changes the EOT outcome dramatically. Document concurrency the day it arises, not in arbitration.
Explore in the AcademySite overheads, head-office overheads, finance charges and acceleration costs. Distinguish recoverable prolongation from disruption cost.
Open related calculatorIndividually trivial variations that, taken together, fundamentally change the scope. The cumulative impact claim is where most disputes are won or lost.
Open related calculator04 — Recovery
Step-by-step playbooks for projects already in distress. These are the same first-90-day routines we run when we are parachuted onto a recovery: baseline triage, schedule resequencing, cost re-forecast, governance reset and stakeholder communication. Every step links to a calculator that turns judgement into numbers.
Re-run the health score and the portfolio health index. Identify the three controls that are missing, not the fifty that are imperfect.
Open related calculatorCritical path risk score, float erosion analysis, and a frank conversation about which scope can be deferred to a second phase.
Open related calculatorRefresh EAC and TCPI. If TCPI exceeds 1.10 the project cannot be recovered on cost without a baseline reset.
Open related calculatorReplace the RAG dashboard with a leading-indicator dashboard. Brief the steering committee on the new forecast with full transparency.
Open related calculator05 — Dashboards
A reference gallery of the dashboards we actually use in PMOs — executive KPI views, portfolio health, risk exposure heatmaps and EVM control charts. The point is not visual polish; it is which metric belongs on which screen, and what decision it is supposed to trigger.
Five numbers, one page, monthly. SPI, CPI, EAC variance, top-three risks, top-three issues. If it does not fit on one page the executive will not read it.
Open related calculatorOne composite index per project across the portfolio. Sortable, colour-coded by trajectory, not by current status.
Open related calculatorProbability times impact, weighted by proximity. The dashboard that turns the risk register from a compliance artefact into a forecasting tool.
Open related calculatorRisks, Assumptions, Issues, Dependencies — surfaced next to the KPIs so the conversation stays connected to the numbers.
Open related calculator06 — Scheduling
Practical scheduling intelligence — how to set realistic durations, how to use earned schedule when SPI lies near the end of a project, when to compress and when to descope, and how to defend a schedule under independent assurance review.
Past the 60% mark SPI converges to 1.0 even on late projects. Earned schedule keeps telling the truth right up to handover.
Open related calculatorCrashing the critical path is rarely linear. Model the cost of compression against liquidated damages before you authorise overtime.
Open related calculatorAn unlevelled schedule is a wish list. Run resource utilisation before signing the baseline, not after.
Open related calculatorLong-lead equipment frequently sits on the real critical path, even when the CPM software says otherwise. Model it explicitly.
Open related calculator07 — Cost & EVM
Earned value, forecasting and cash management — written for engineers, not auditors. We focus on the small set of EVM metrics that actually drive decisions, the failure modes of each, and the cash-flow consequences that the EVM textbooks tend to skip.
By the 15% milestone, CPI rarely improves more than 10%. If CPI is 0.85 at 15% complete, the final cost overrun is already locked in.
Open related calculatorEAC by CPI, EAC by CPI×SPI, and bottom-up EAC. Triangulate. If the three differ by more than 10% the team does not yet know what the project will cost.
Open related calculatorCost forecast tells you whether the budget holds. Cash flow forecast tells you whether you survive next quarter. Both belong on the steering committee deck.
Open related calculatorContingency is not a single percentage on top of the estimate — it is a risk-weighted reserve. Re-baseline it every quarter against the live risk register.
Open related calculator08 — AI vs Reality
An honest practitioner view of where AI helps in project controls and where it does not. AI is excellent at narrative generation, anomaly detection and pattern recognition across historical schedules. It is poor at replacing judgement on contractual matters, claims strategy and stakeholder politics. The boundary matters.
Status report drafting, schedule narrative, risk-register summarisation and trend detection across multiple projects in a portfolio.
Explore in the AcademySetting baselines, judging concurrency in delay claims, advising on commercial strategy, and any decision where the source data is sparse or politicised.
Explore in the AcademyUse the calculators to compute the numbers, use AI to draft the narrative, and use the PM to decide. Never the other way around.
Open related calculatorMost AI tools hallucinate when project teams use ambiguous terminology. A shared glossary reduces hallucination more than any prompt-engineering trick.
Open Project Controls GlossaryFAQ — Practitioner questions
Short answers to the questions practitioners ask most often about the Intelligence Center, the editorial standard behind it, and how the calculators connect to the briefing material.
The Intelligence Center is an editorial briefing layer for working project controls practitioners — failure patterns, mega-project lessons, delay-claims reference material, recovery playbooks, PMO dashboards, scheduling, EVM and AI. Each section links to a calculator that turns the idea into a defensible number.
Content is written and reviewed by Dr. Hassan Eliwa, PhD, and the PMMilestone editorial team. Sections are revised continuously as new project controls patterns emerge in practice; the page itself is treated as a living reference rather than a dated blog.
A blog publishes opinion. The Intelligence Center curates recurring controls patterns — what failed, why the controls did not catch it, and which leading indicator would have surfaced it earlier — and connects each pattern to a calculator on PMMilestone that practitioners can run themselves.
Every section links to the relevant free calculator — SPI, CPI, EAC, TCPI, earned schedule, float erosion, critical-path risk, schedule compression, delay impact, resource utilisation, cash flow forecast, risk exposure, contingency reserve, portfolio health, executive KPI dashboard, RAID log and variation-order impact, among others.
Yes. The AI vs Real Project Controls section is written from a practitioner perspective: where AI genuinely accelerates the PMO (narrative drafting, anomaly detection, trend summarisation) and where it quietly fails (baselines, concurrency in delay claims, commercial strategy). The boundary matters.
The Intelligence Center is practitioner-focused rather than exam-focused, but the underlying vocabulary, formulas and EVM treatments align with PMI and AACE practice standards. For exam preparation, pair it with the PMP Question Bank and the Project Controls Glossary on PMMilestone.
The Intelligence Center is the briefing layer. The Academy is the learning layer, the Calculators are the decision layer, and the Glossary is the shared vocabulary. Start where it matters today.
The latest Academy tracks and knowledge pillars, sorted newest first.
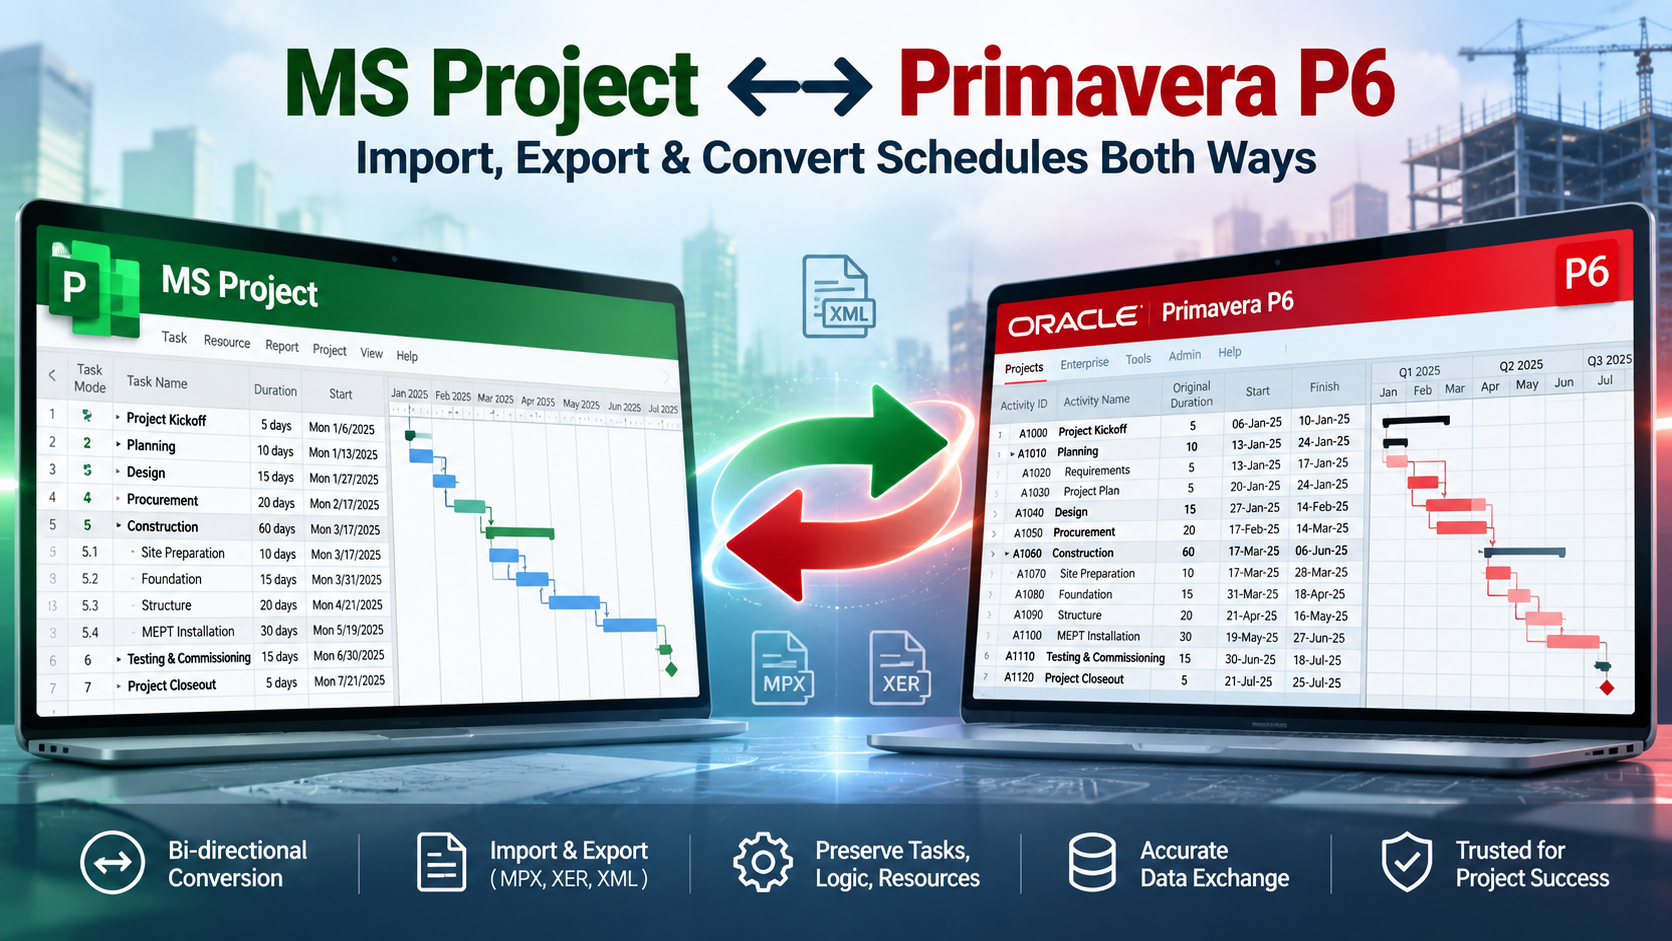
A field-tested guide to deciding whether to migrate, rebuild or archive—and proving the converted P6 schedule can be trusted.
Read article
A practitioner's guide to calendars, constraints, float, lags and progress when a Microsoft Project programme has to become a P6 submission.
Read article
Nine credentials, one decision. This roadmap starts with your role, your documentable years and your five-year target — then tells you which AACE certification actually belongs to you.
Read article
Delay analysis is not a report about lateness — it is a causation argument. A practitioner's guide to method selection, window analysis, concurrency and gross-to-net entitlement.
Read article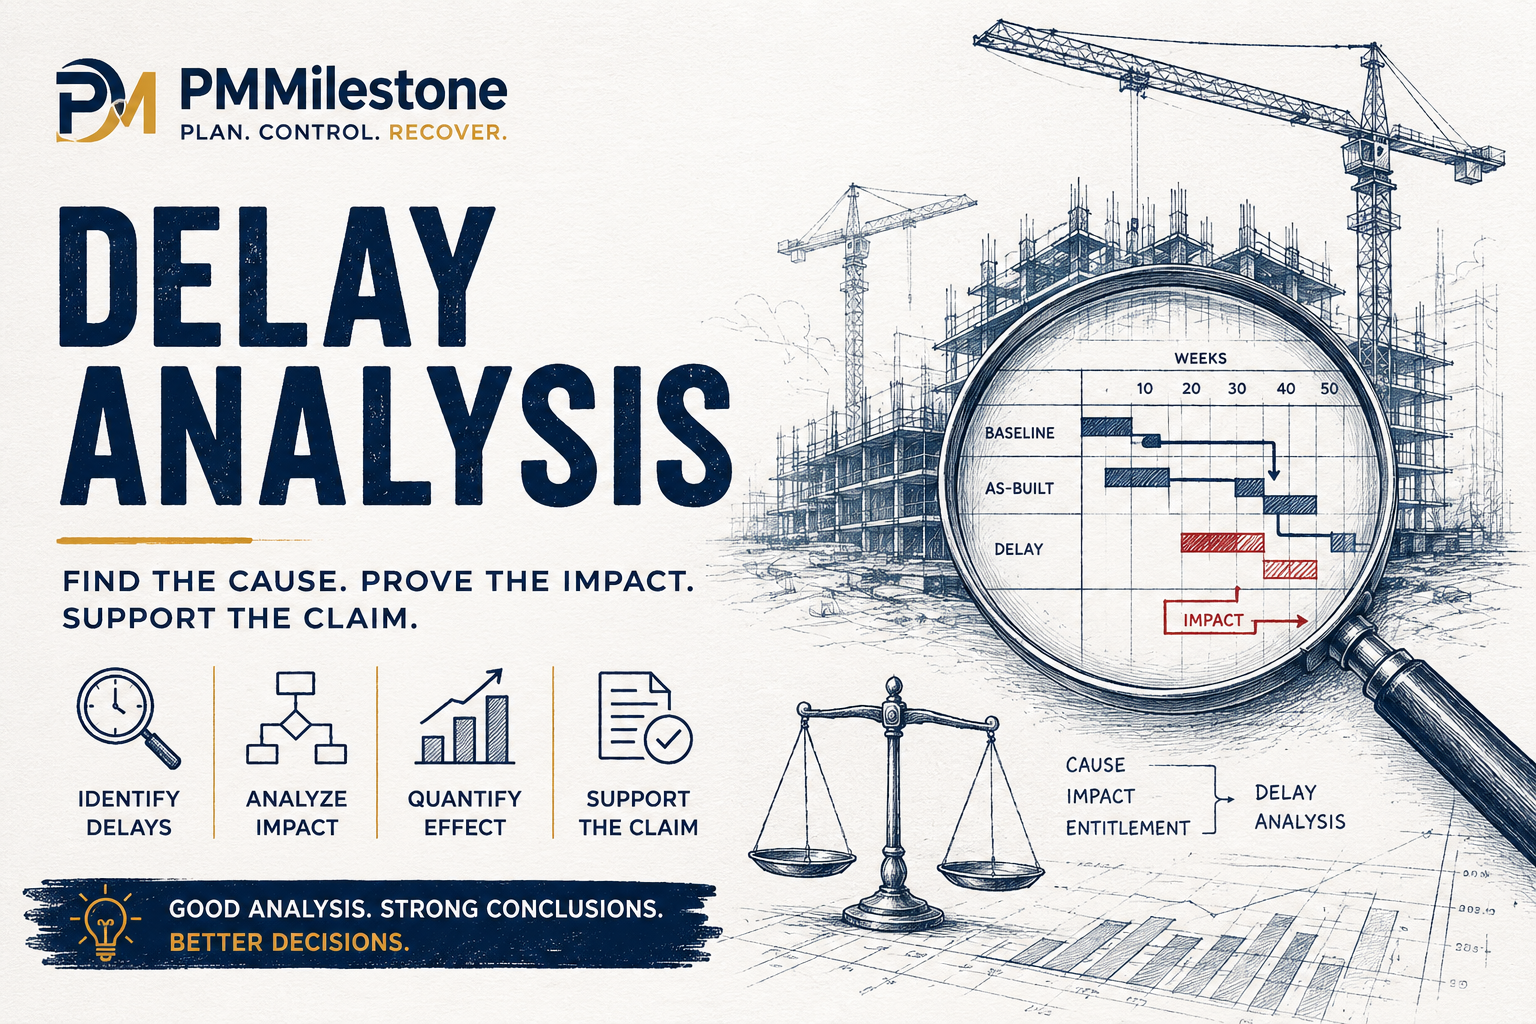
A practitioner's guide to forensic delay methods — TIA vs windows analysis, concurrency under the SCL Protocol, and the evidence that turns an analysis into an entitlement.
Read article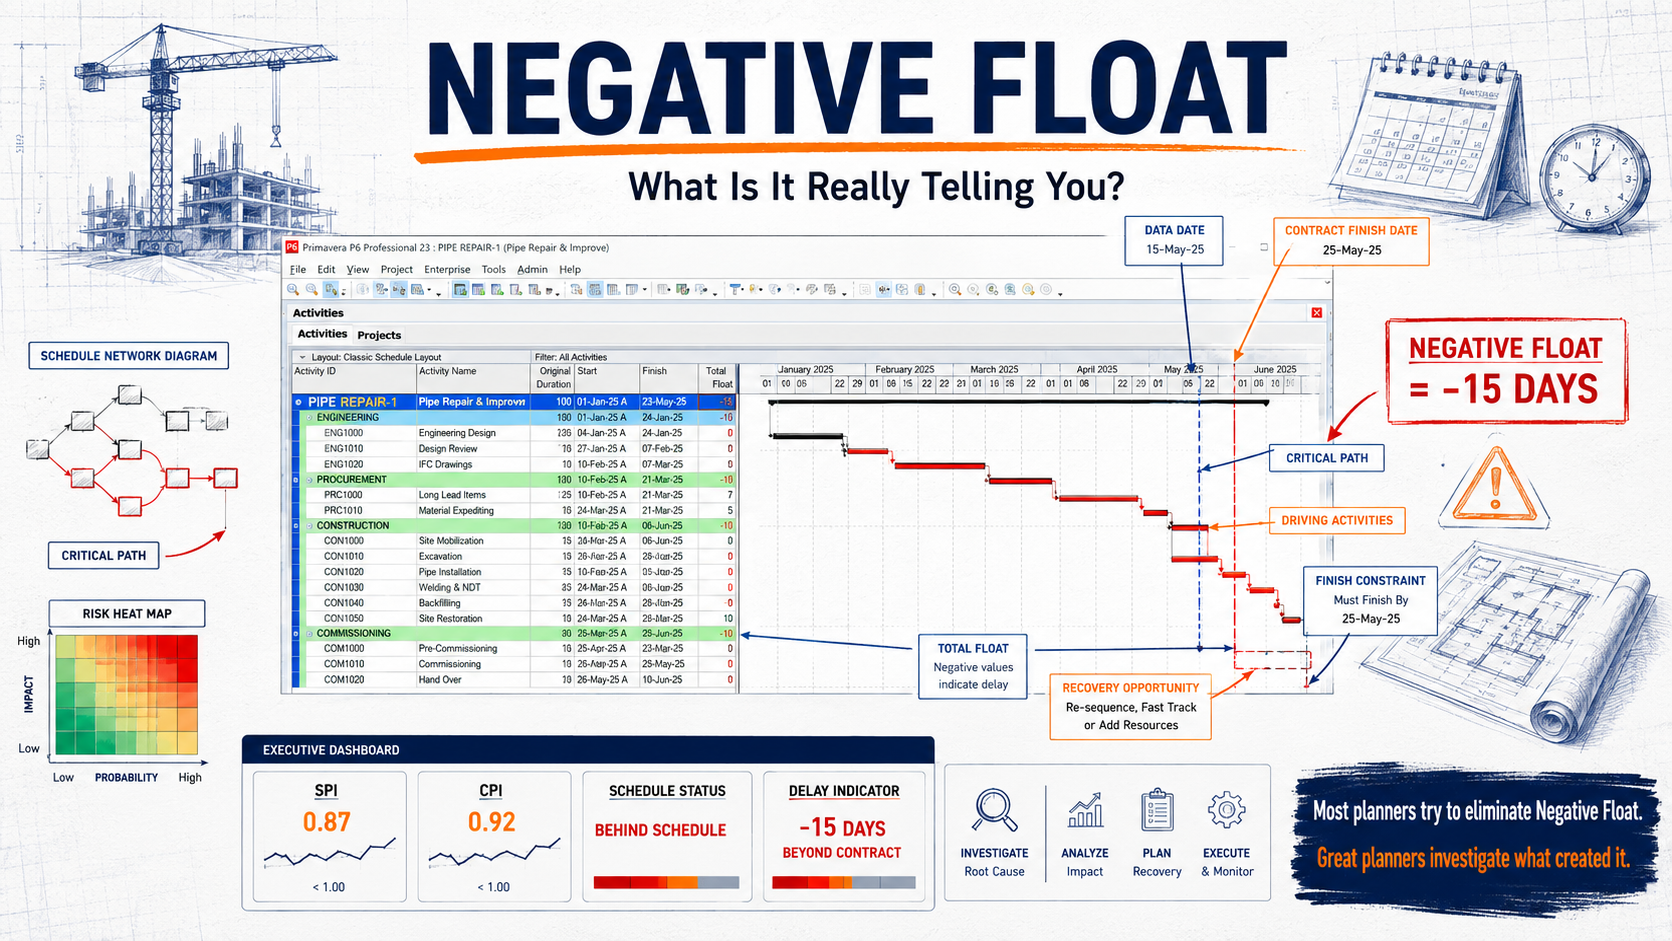
A field guide from 120+ schedule audits: what negative float really means in P6, the six root causes, and the repair workflow that fixes causes rather than hiding symptoms.
Read article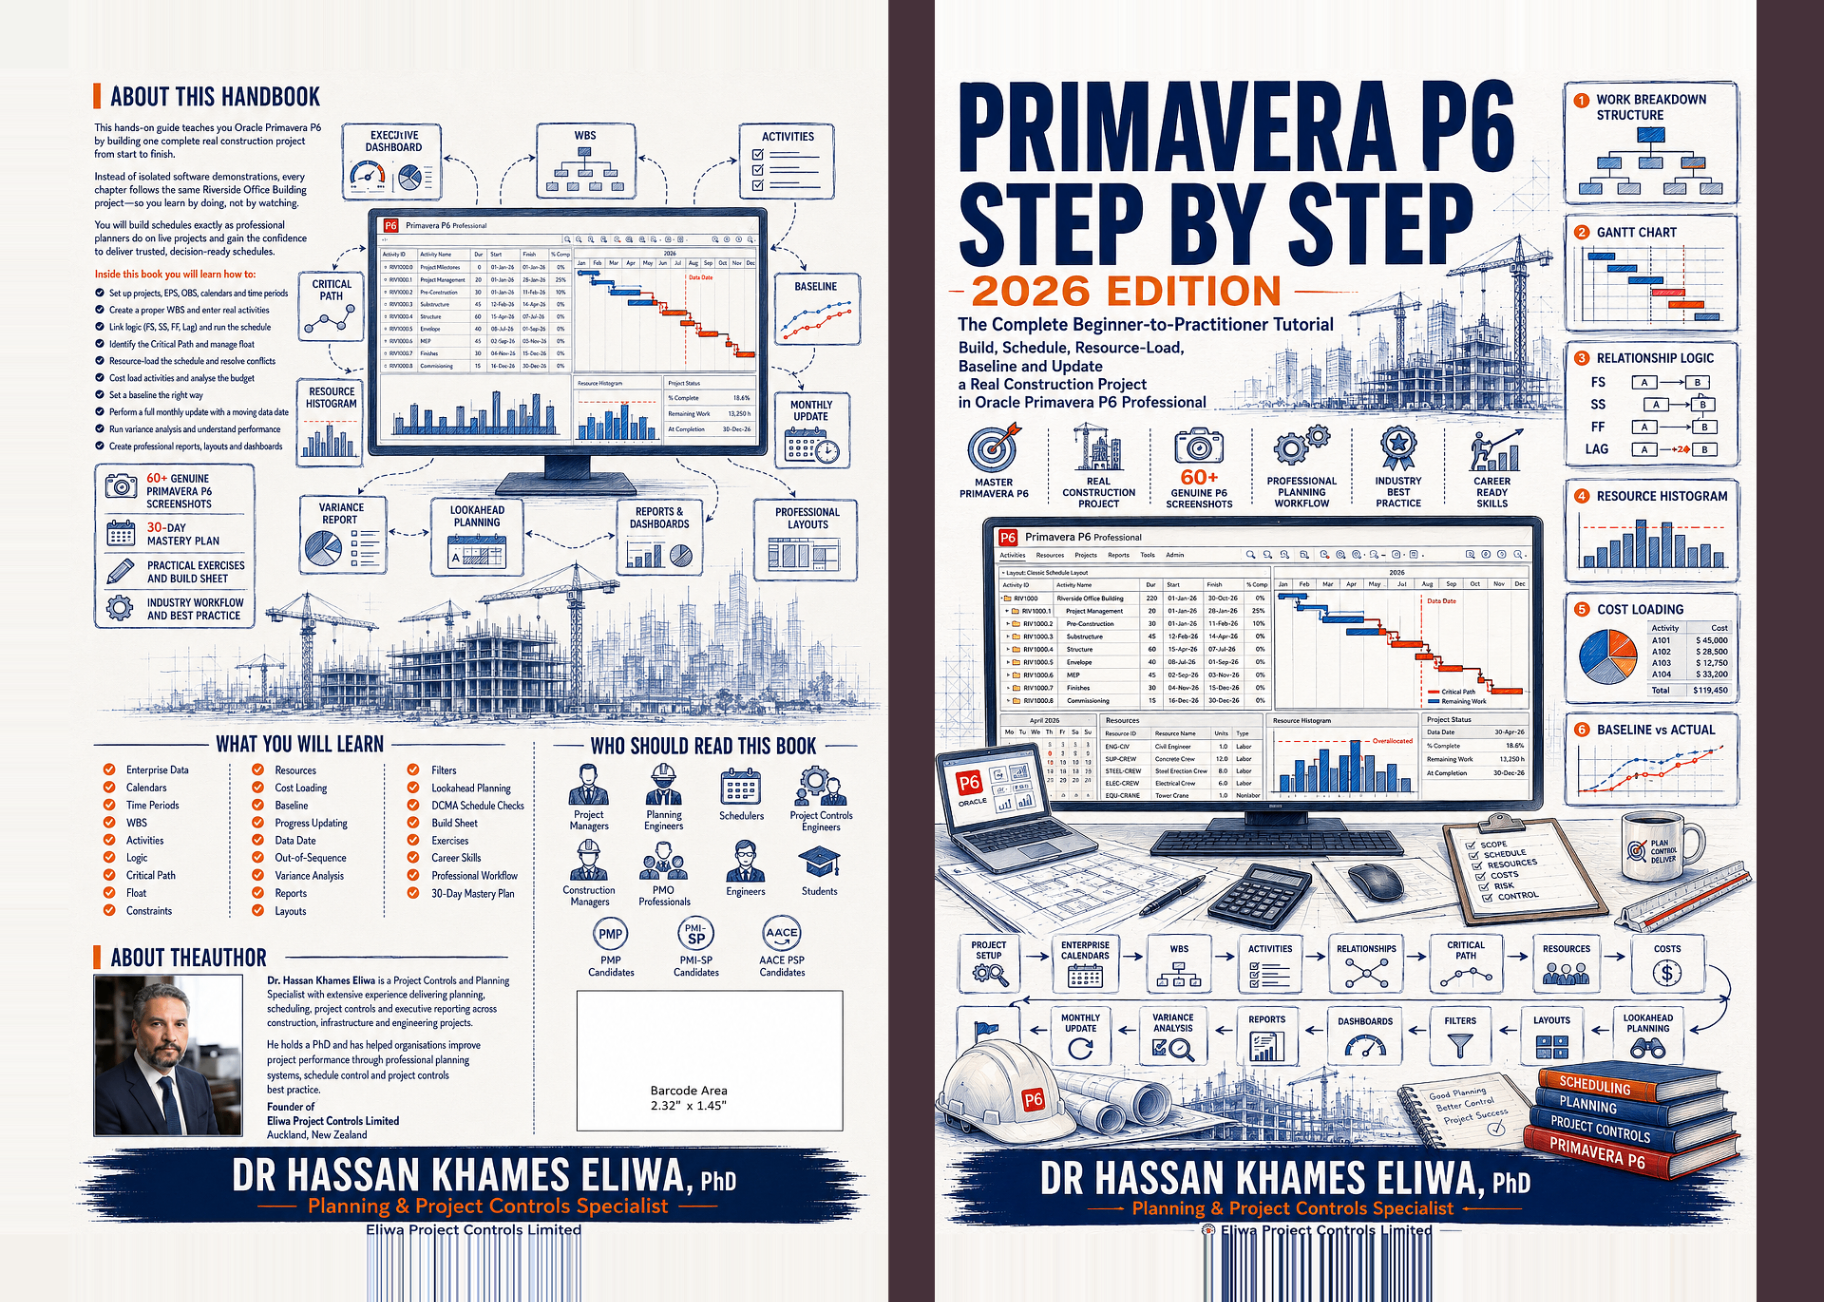
An editorial review of Primavera P6 Step by Step — 2026 Edition by Dr. Hassan Khames Eliwa: one continuous Riverside Office Building project, 60+ genuine screenshots, calendars, WBS, logic, baselines, resource loading, and a full monthly update.
Read article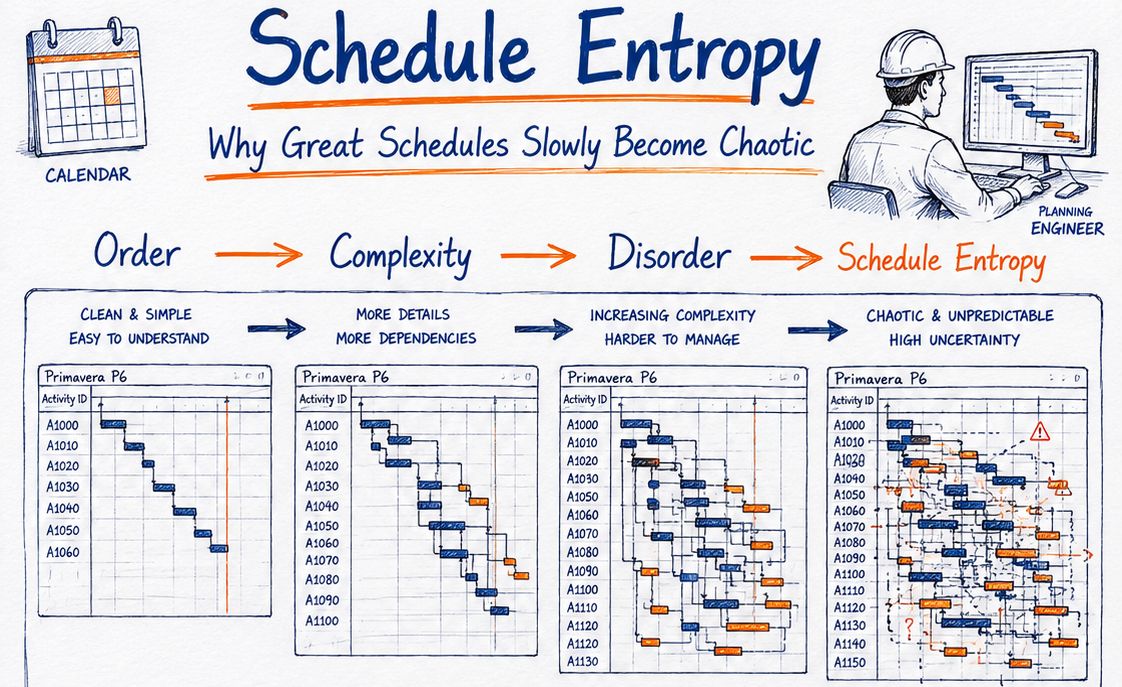
Every planner has watched a beautiful baseline decay into chaos over a few update cycles. Schedule entropy is the mental model that explains why — and how to stop it.
Read article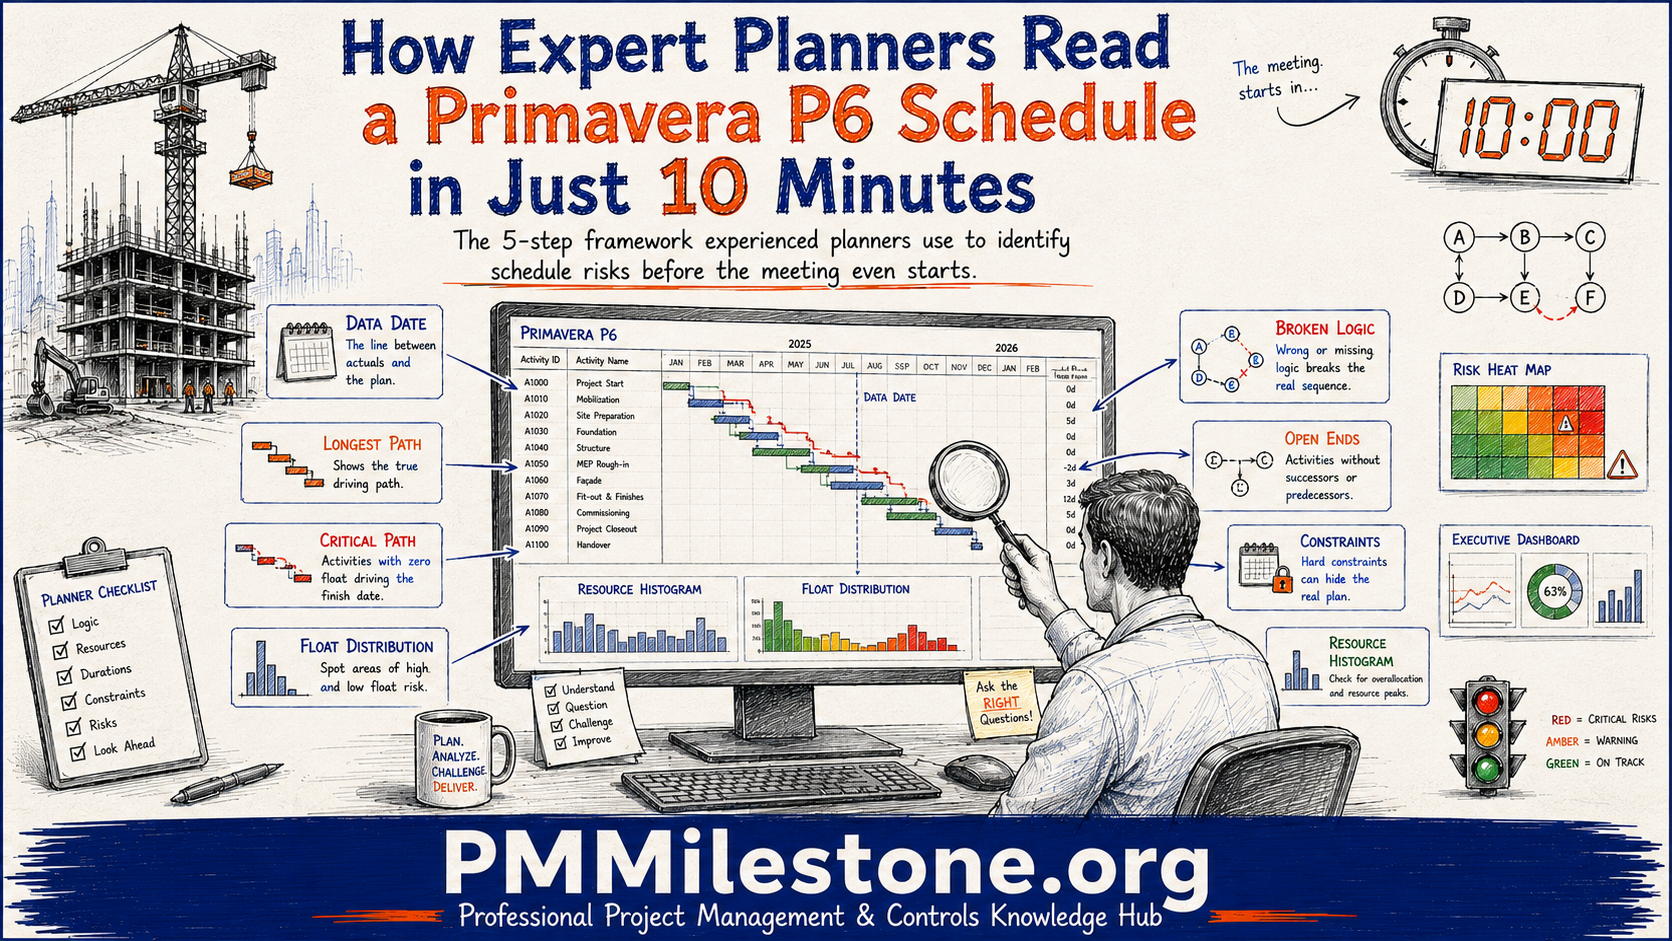
The exact five-pass sequence experienced planners use to size up an unfamiliar Primavera P6 programme before a meeting starts — and the warning signs they never miss.
Read article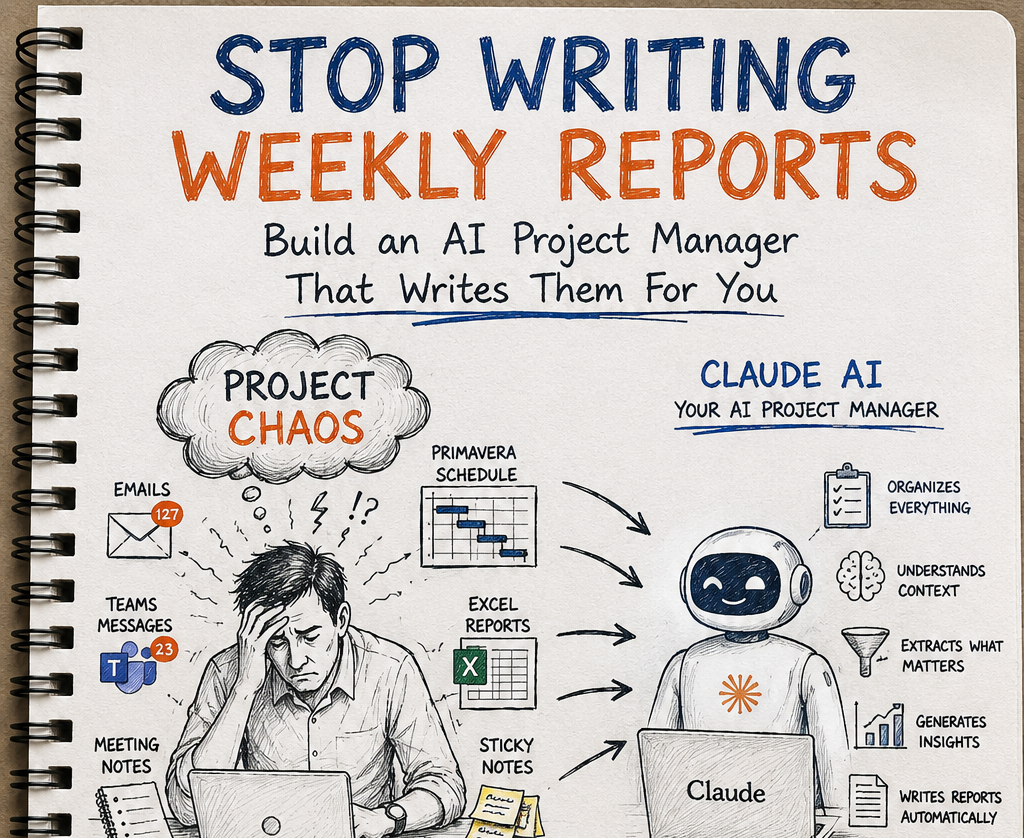
A field guide for planners, project controls leads and delivery managers — how to set up an AI project manager that captures the noise as it happens and writes the weekly report for you, so your time goes back into judgement, not formatting.
Read article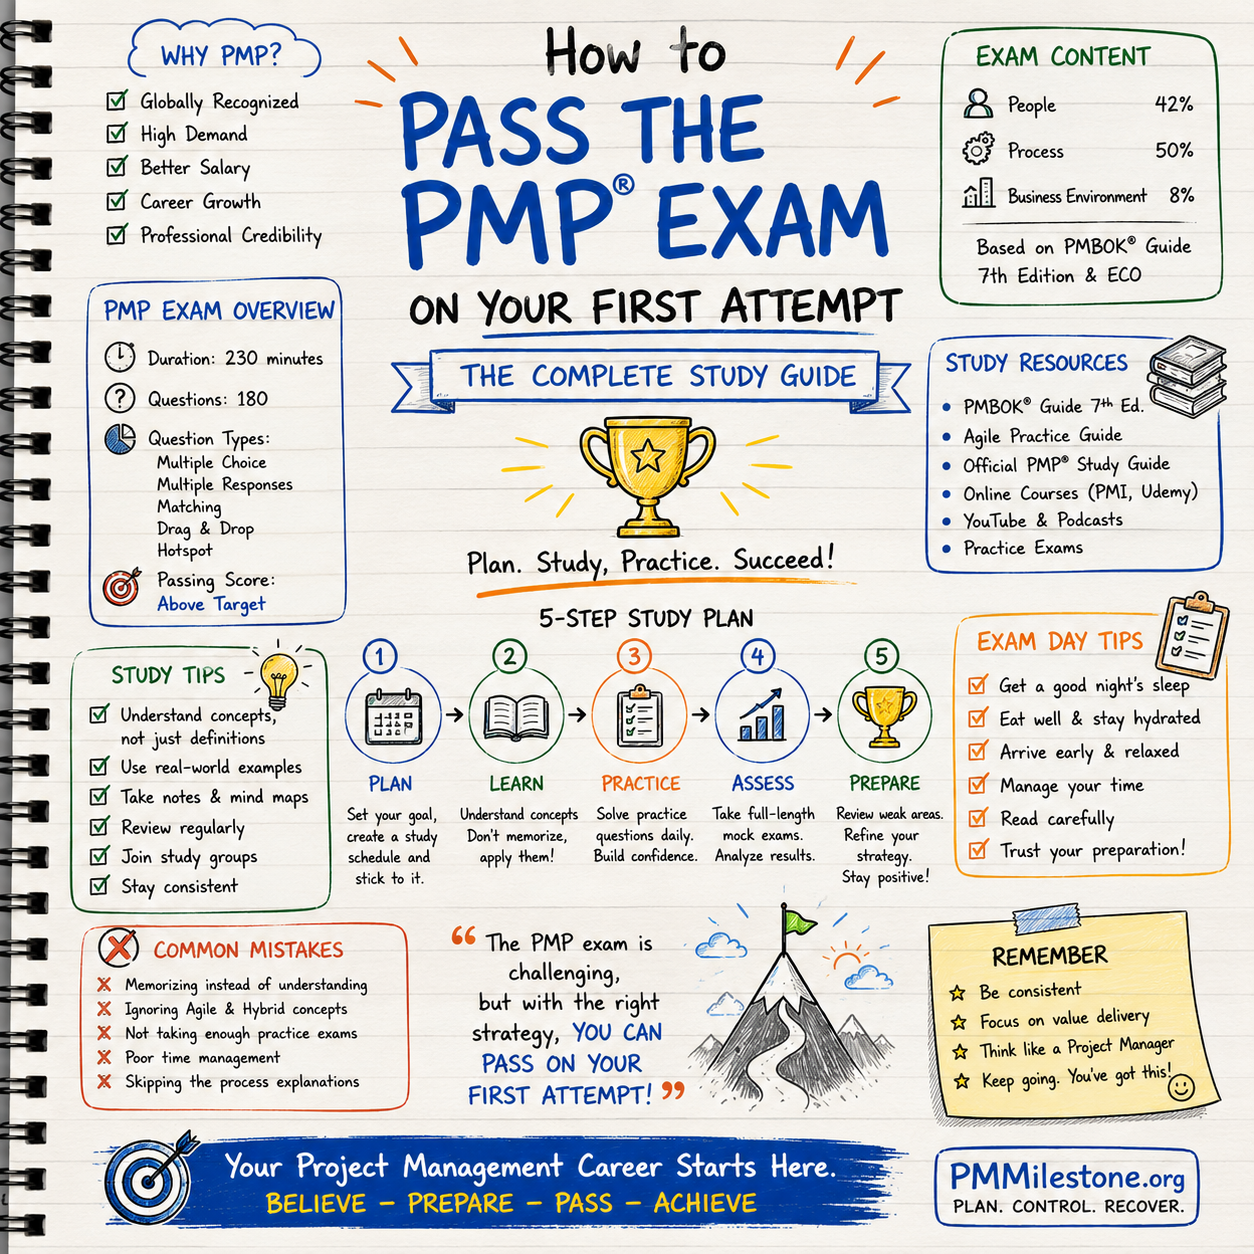
A complete, practitioner-written PMP study guide — exam format, ECO domain weightings, an 8-week study plan, common mistakes and an exam-day playbook to pass on the first attempt.
Read article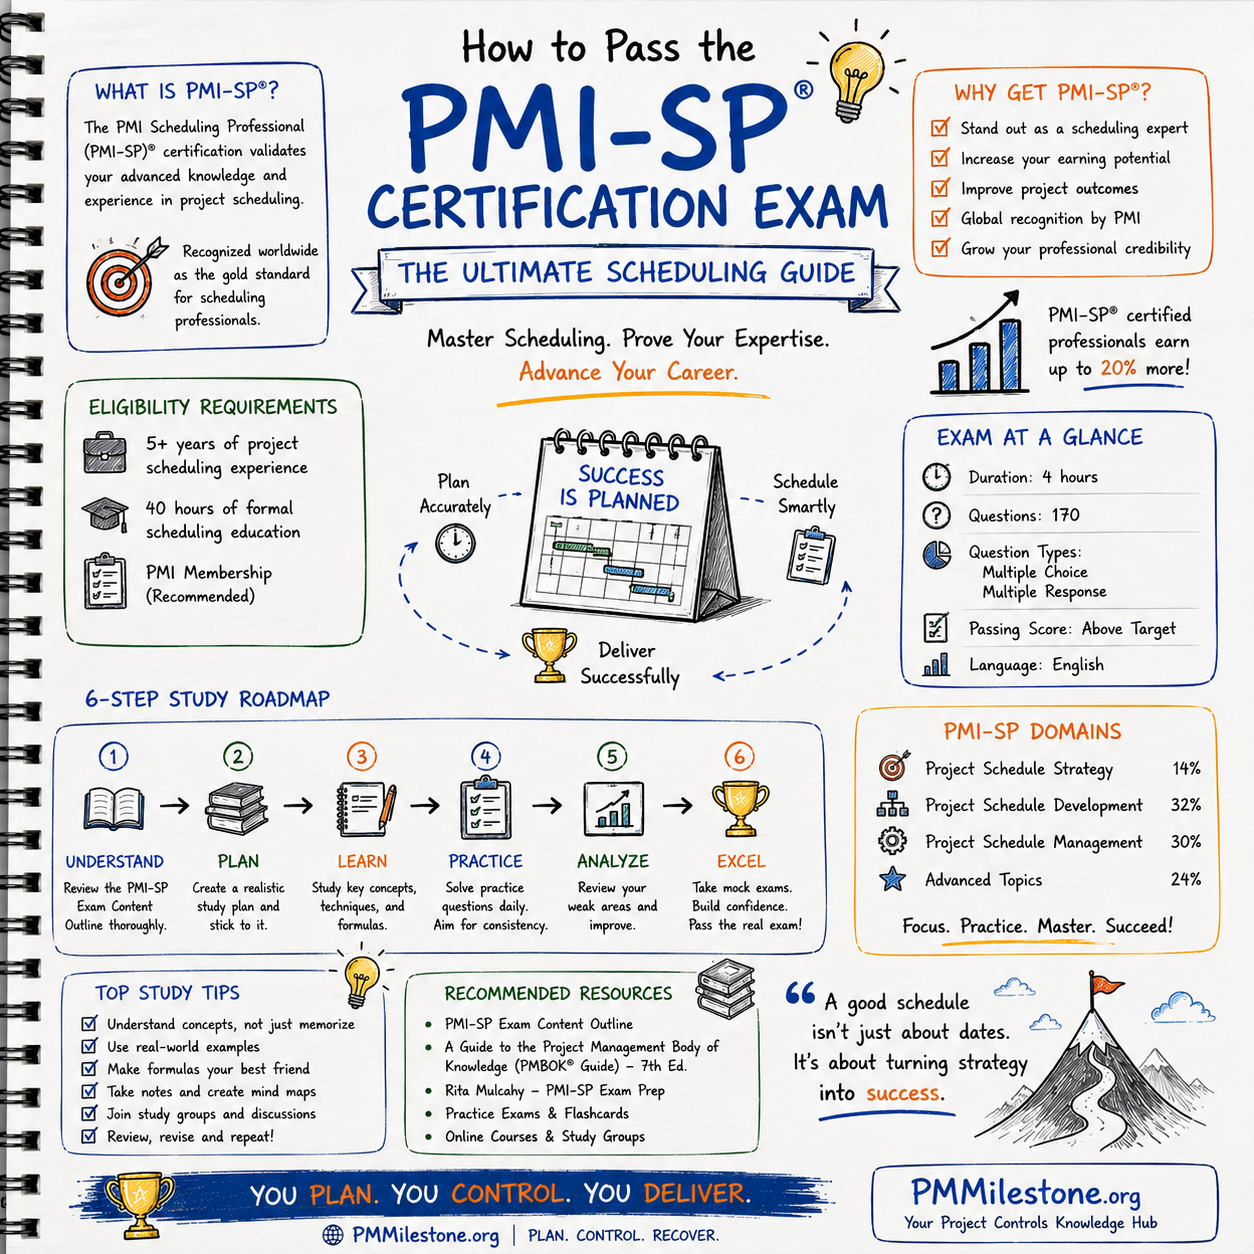
A planner-written guide to the PMI-SP credential — real exam format, five-domain weighting from the current ECO, eligibility paths, a ten-week study plan and the formulas worth knowing cold.
Read article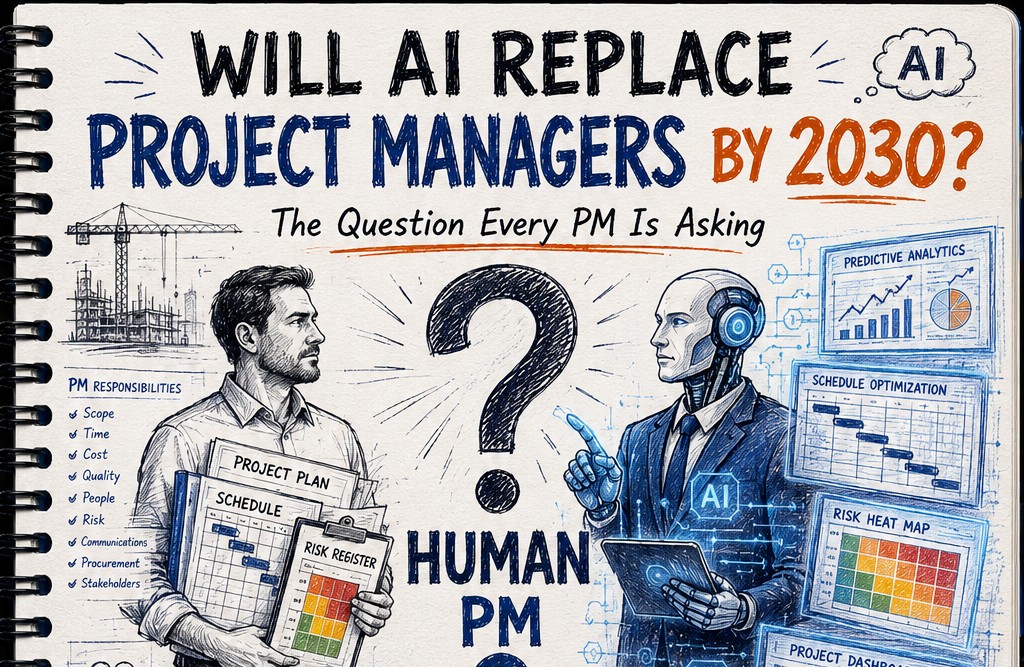
A practical, no-hype answer to the question every PM is asking — what AI will automate, what it can't replace, and how to make yourself more valuable as the tools improve.
Read article
PMP, PMI-SP, PMI-RMP, AACE CCP, AACE PSP and EVP compared — choose the right certification path for planning, cost and controls professionals.
Read article
A practitioner's career roadmap with skills, certifications and salary at every stage — from junior planner to director of project controls.
Read article
PV, EV, AC, CPI, SPI, EAC, TCPI, S-curves and a worked construction example — the definitive EVM reference for project controls practitioners.
Read article
Delay analysis methods, EOT claims, concurrency, prolongation cost and recovery strategies — the full forensic playbook for construction delay disputes.
Read article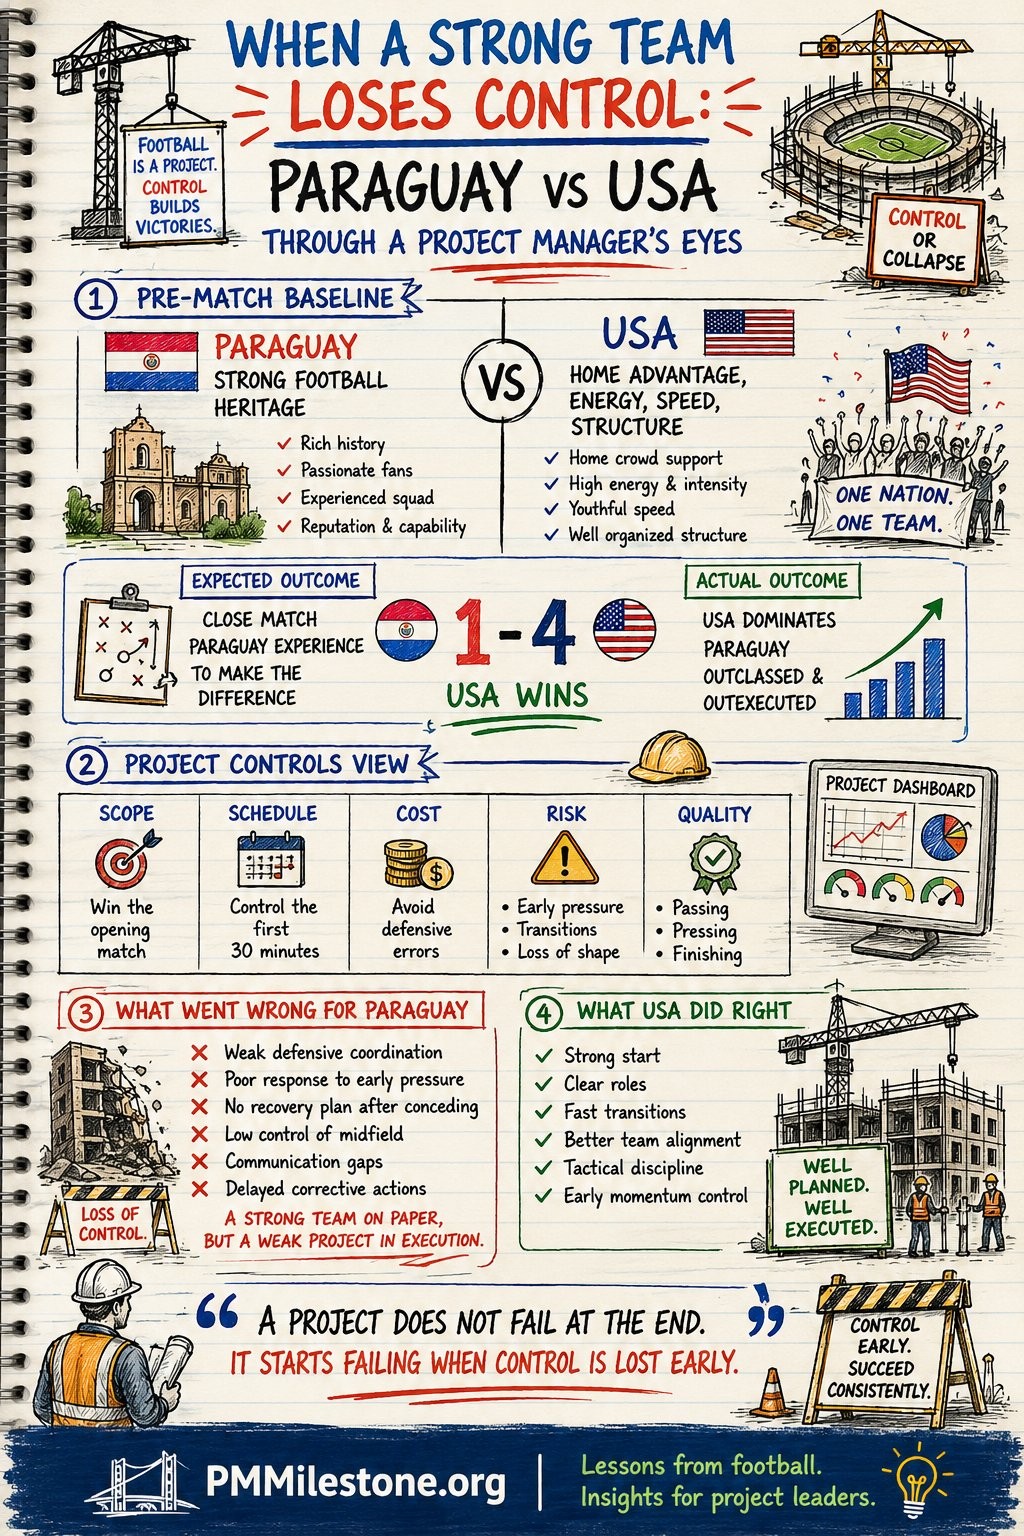
What can project managers learn from Paraguay's 1–4 loss to USA? Project controls lessons on risk, recovery planning, dashboards, SPI, CPI and leadership — told from the site office.
Read article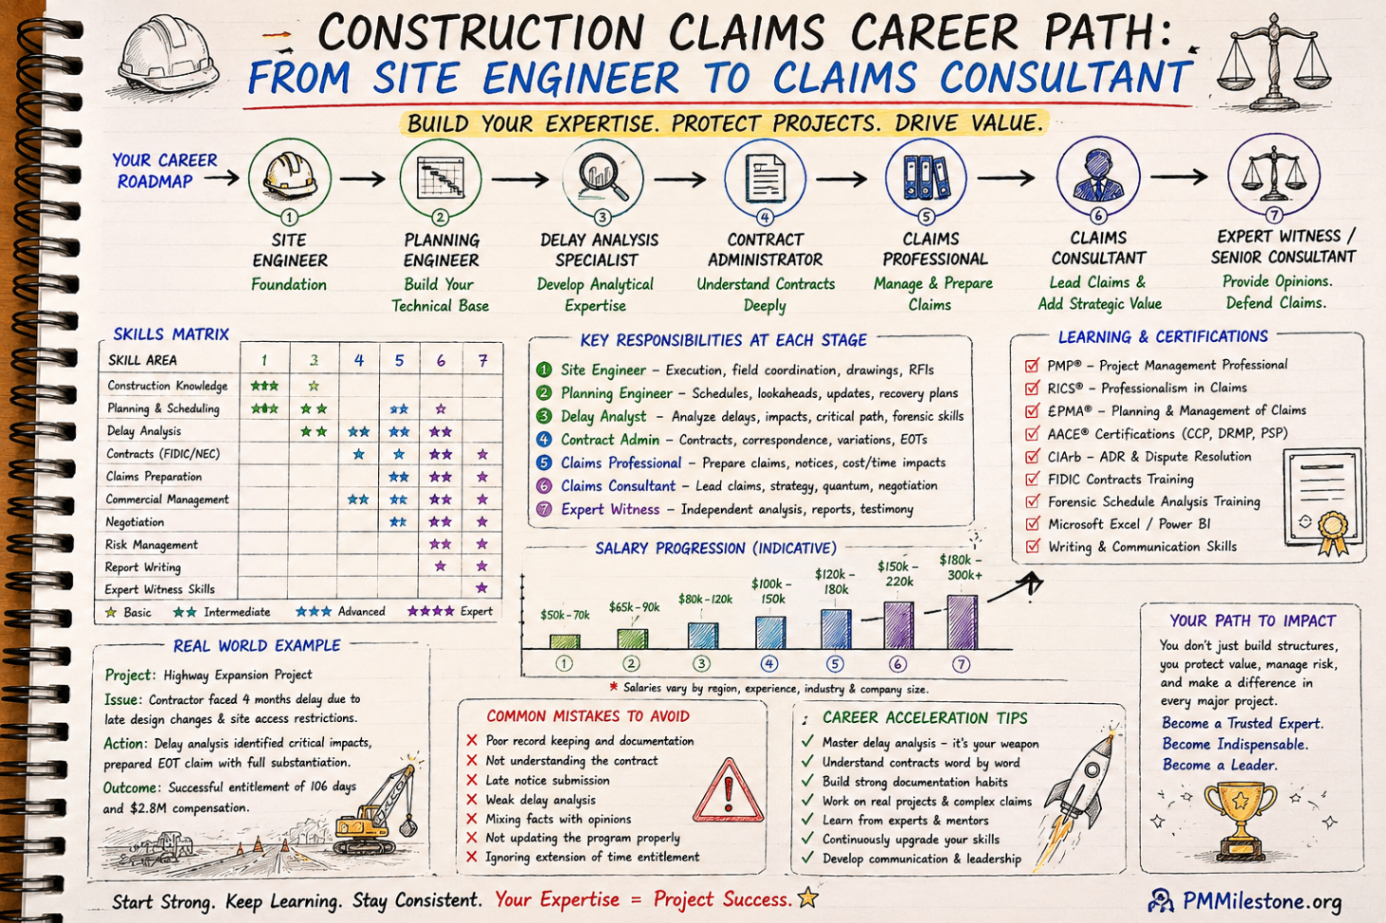
A practical leadership roadmap from junior project controls engineer to director, with role-by-role expectations, technical and leadership skill progression, salary examples and long-range development plans.
Read article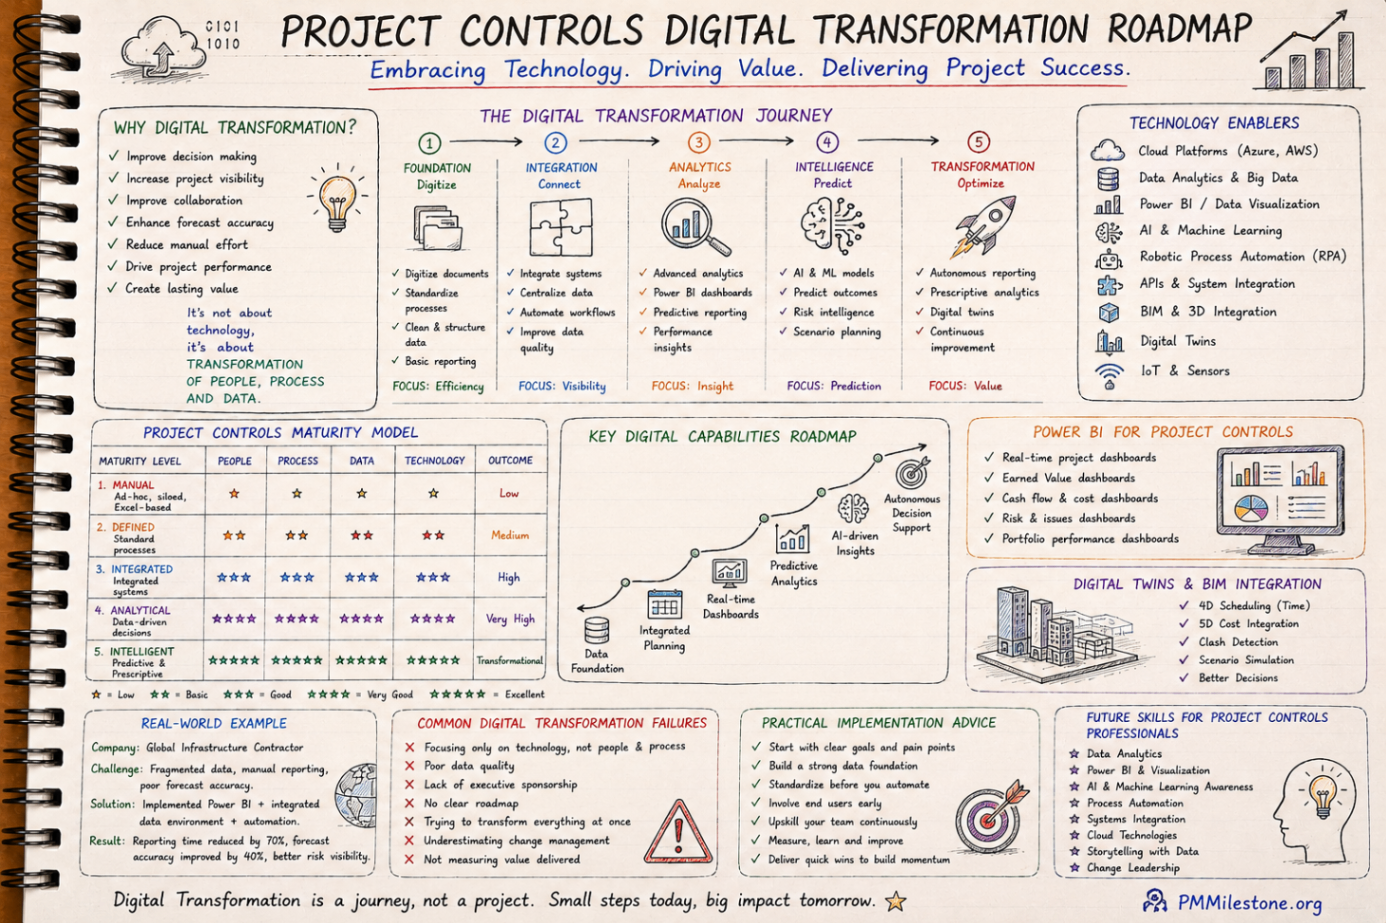
A practical learning path for understanding how large infrastructure projects are governed, planned, reported and controlled across PMO, schedule, cost, risk and executive decision layers.
Read articleDeep-dive pillar articles covering EVM, delay analysis, scheduling, risk and project controls — refreshed on every visit.
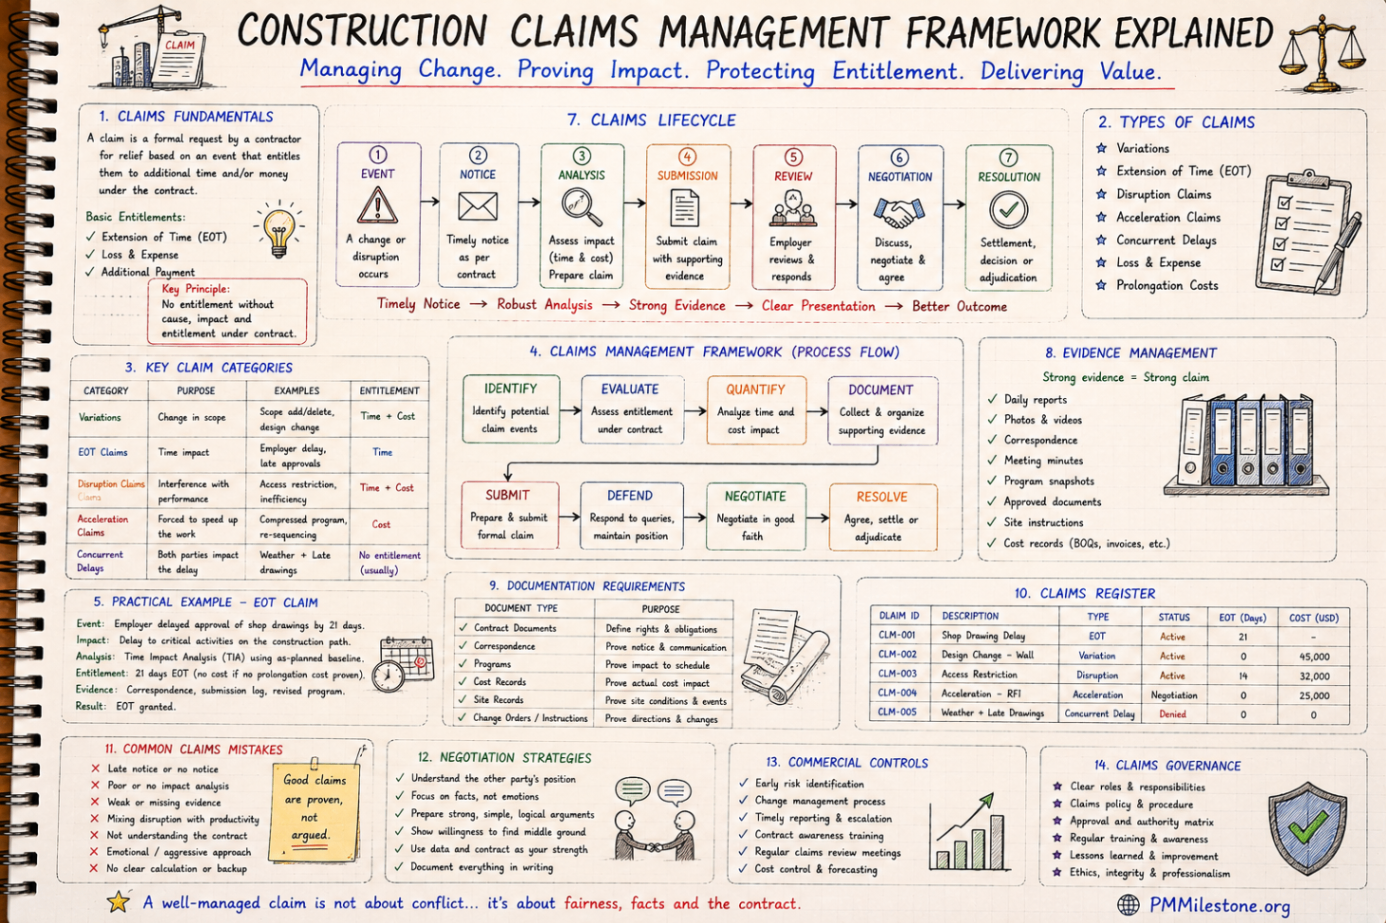
A practical claims management framework for construction and infrastructure projects covering entitlement, records, analysis, negotiation and governance.
Read pillar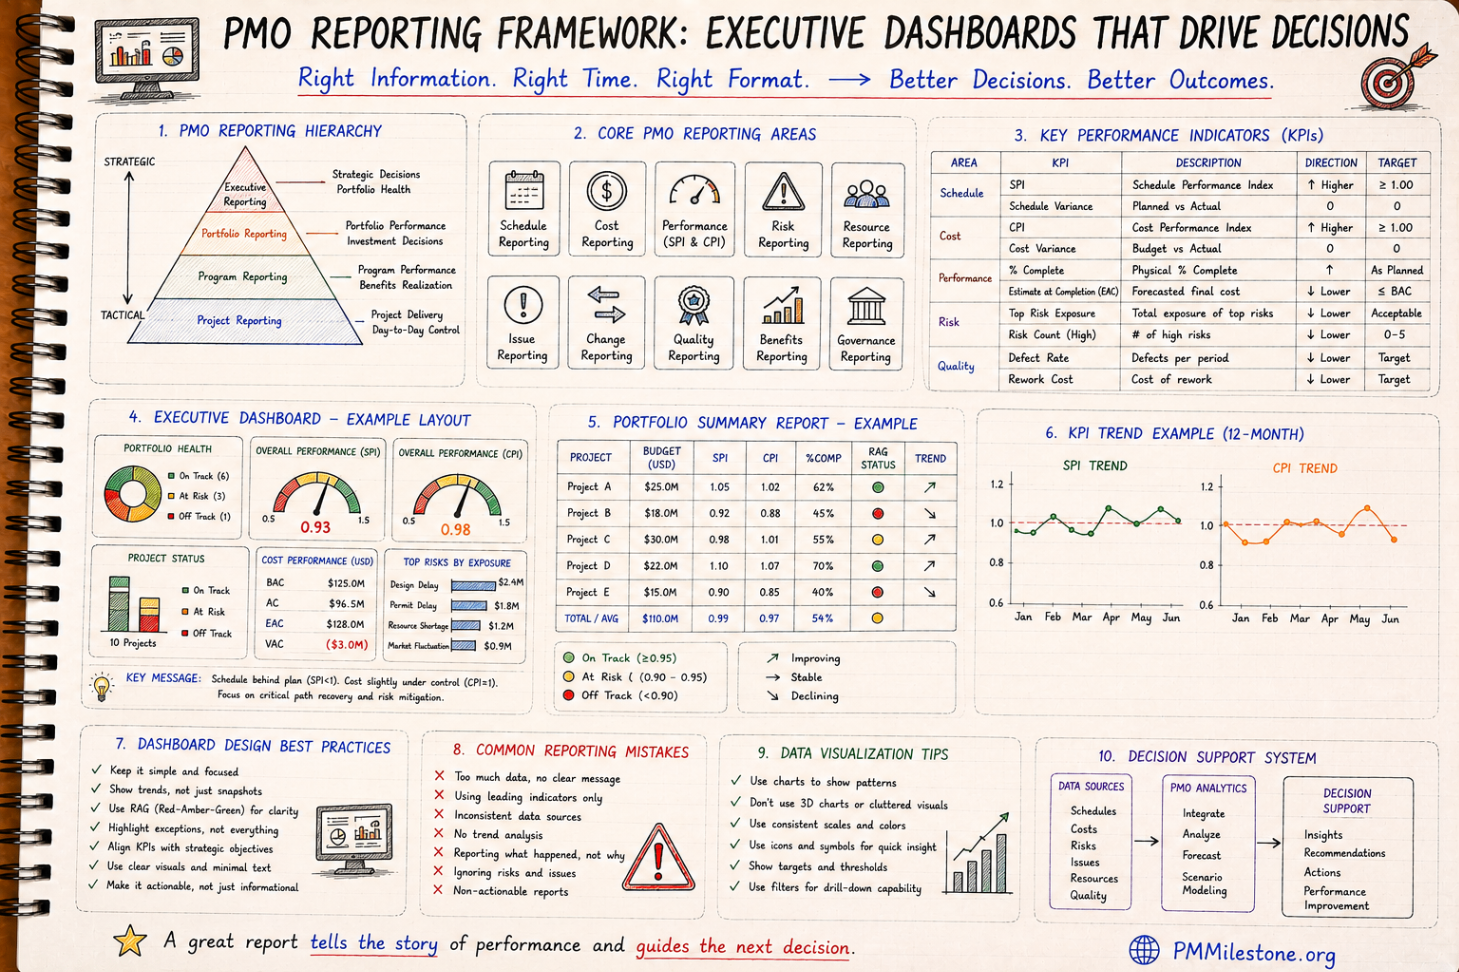
A reference guide to executive PMO reporting covering dashboard structure, KPI choice, portfolio views, reporting cadence and common reporting mistakes.
Read pillar
Practitioner-written explainers across EVM, planning, forecasting, risk and PMO design — read as a syllabus or as a refresher.
Read pillar
Concept questions in the style of PMP / PMI examinations, plus practical scenarios from real construction and PMO environments.
Read pillar
More than thirty client-side calculators covering EVM, schedule, risk, construction productivity, contingency, PMO maturity and career planning.
Read pillar
Auto-synced articles from PMMilestone Intelligence Center bring fresh case studies, failure patterns and project-intelligence commentary into the Academy.
Read pillar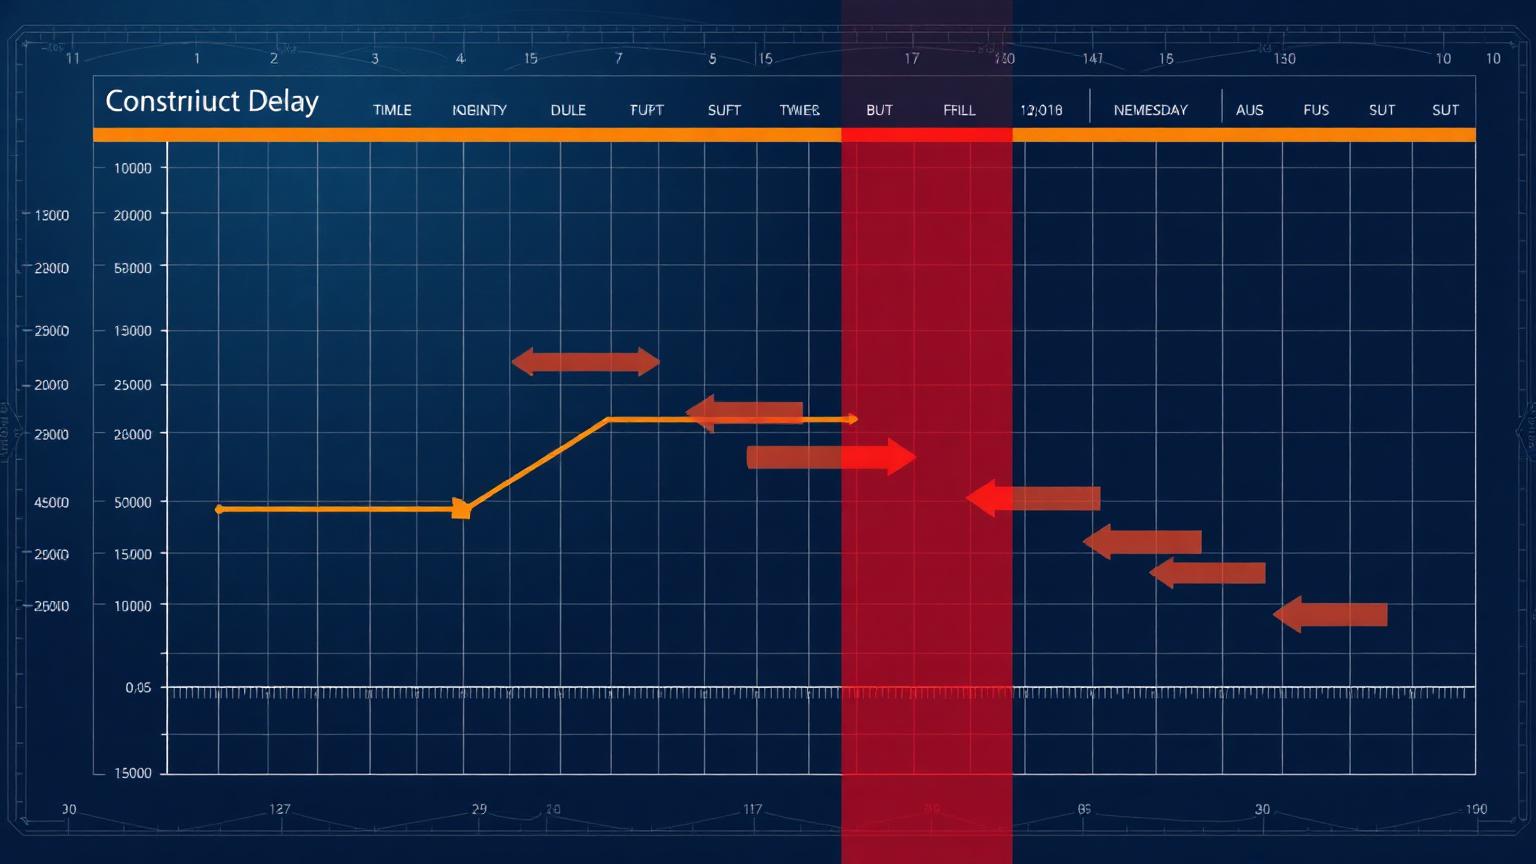
A complete, practitioner-led walkthrough of construction delay analysis: delay categories, methodologies, claims preparation and mitigation strategies for real EPC and building projects.
Read pillar
How to design project controls dashboards that drive real decisions — KPI selection, EVM visualisation, risk indicators, layout patterns and the most common dashboard mistakes.
Read pillar
How professional project controls teams forecast cost, schedule, productivity and cash flow — and how to combine them into a single risk-adjusted view a board can act on.
Read pillar
How to measure, benchmark and improve construction productivity at crew, discipline and project level — and use it as a leading indicator for schedule and cost.
Read pillar
How to design PMO reports and executive dashboards that drive decisions instead of just describing status — KPI hierarchies, narrative structure and the cadence that keeps them honest.
Read pillar
How risk management actually works on mega projects — beyond the register, into quantitative analysis, reserve sizing, risk-adjusted forecasts and structured recovery.
Read pillarDiscover the Elite Project Controls System — a professional intelligence framework for modern project controls, forecasting, executive reporting, AI PM workflows and risk management.
Books by the founder
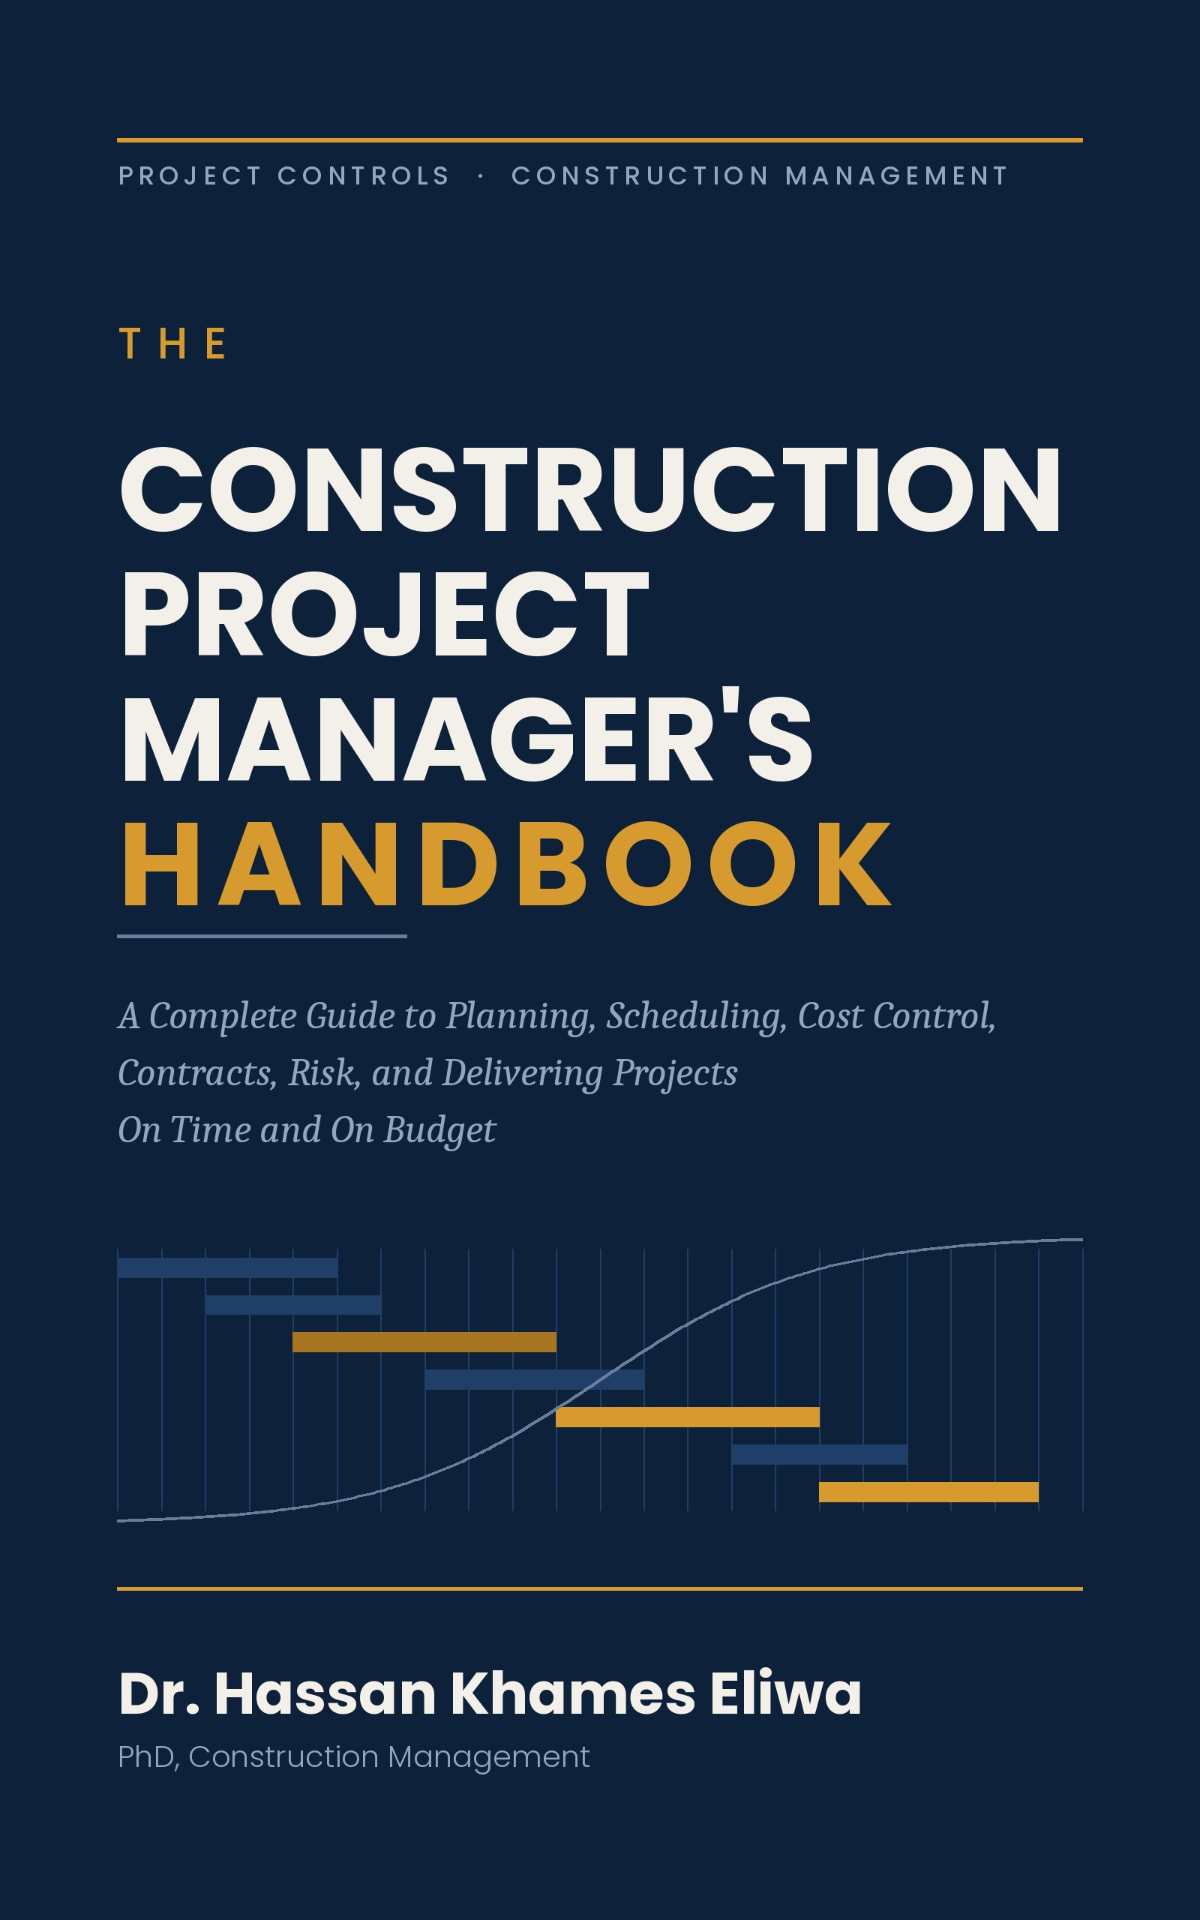
The full construction delivery cycle — planning, cost, contracts and risk — in one practical volume.
PDF from $12.99 USD
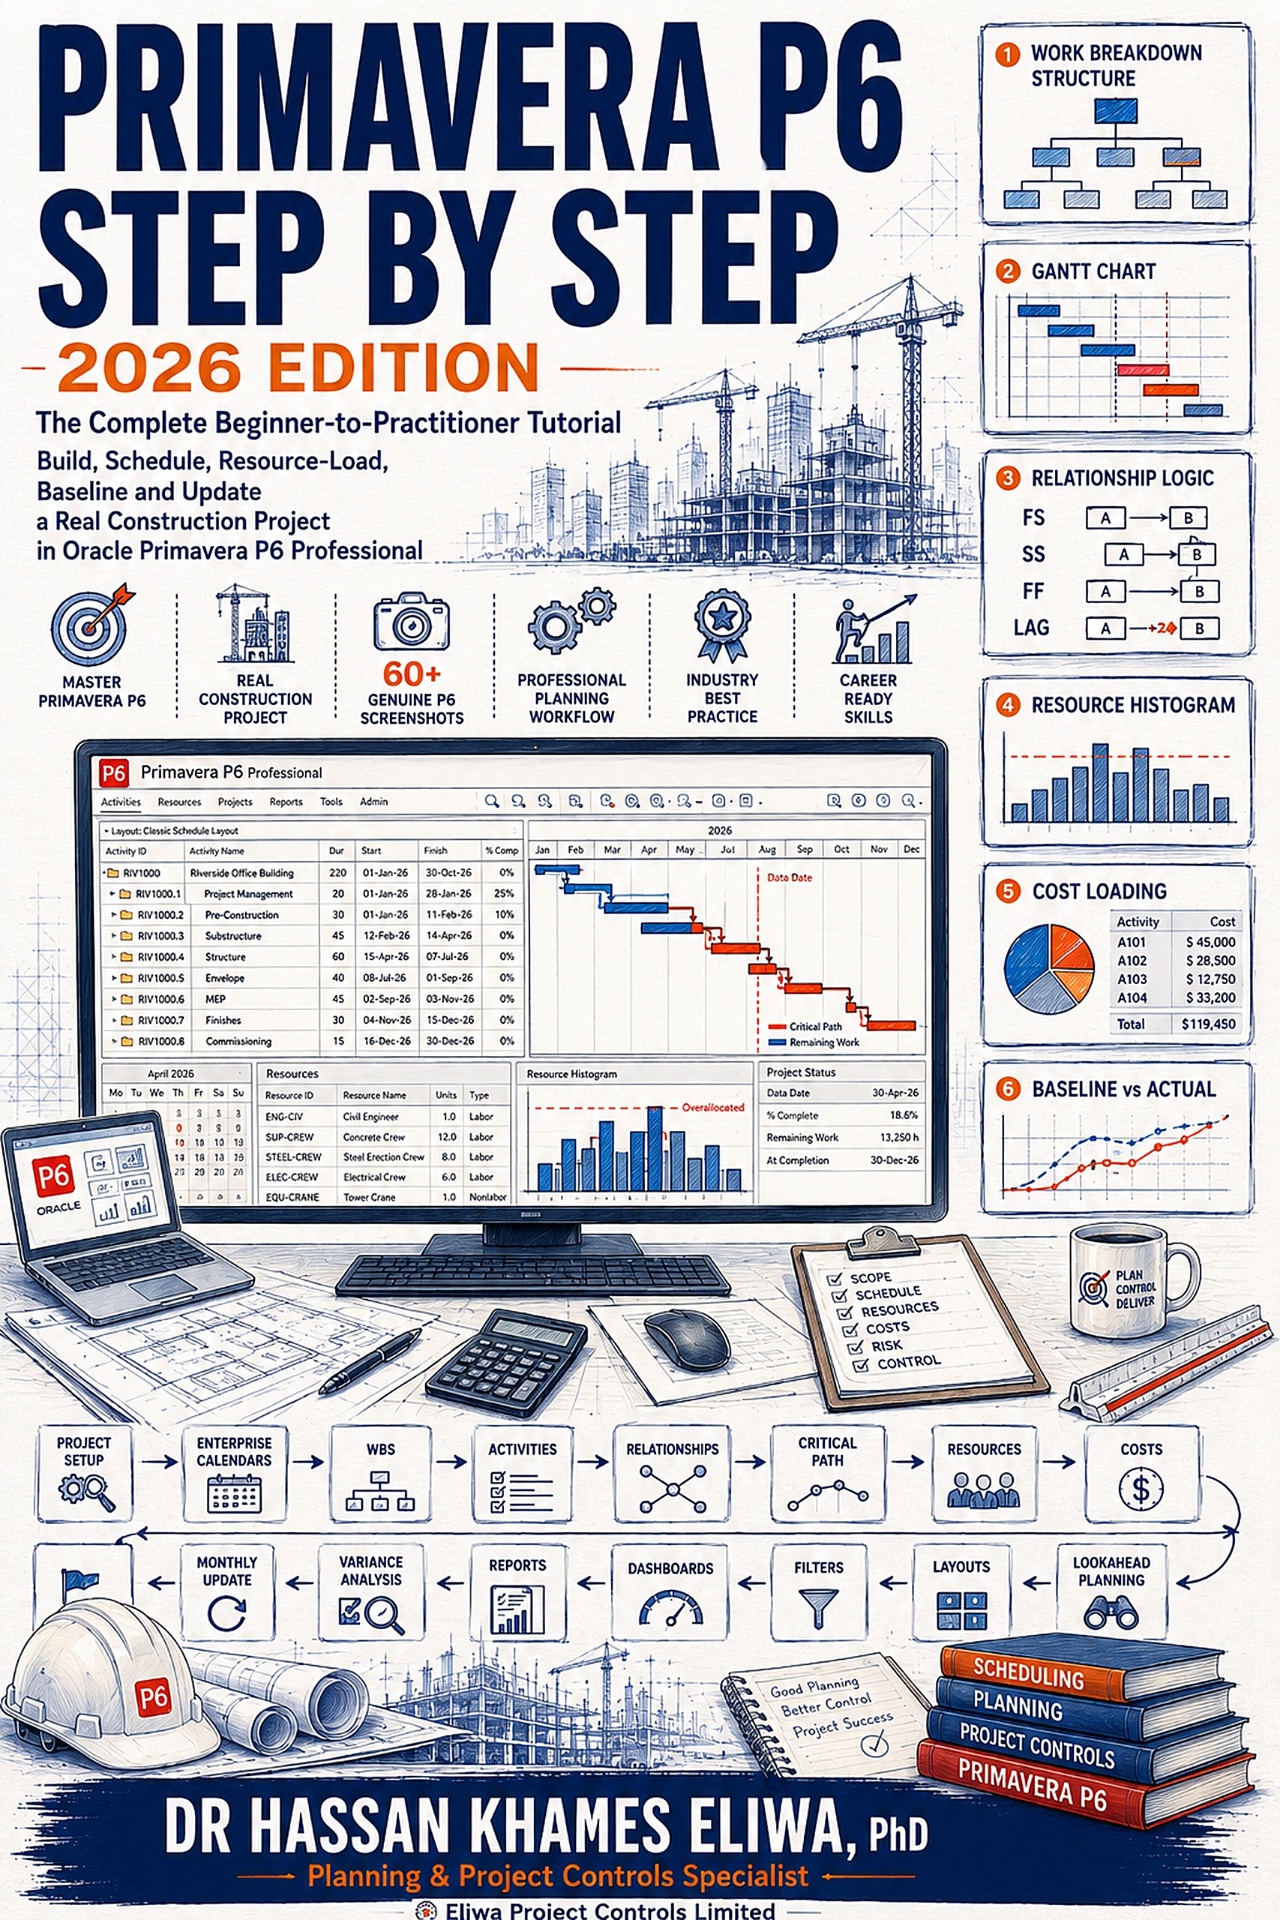
Learn Primavera P6 properly — from first project to fully controlled schedule.
PDF from $19.99 USD
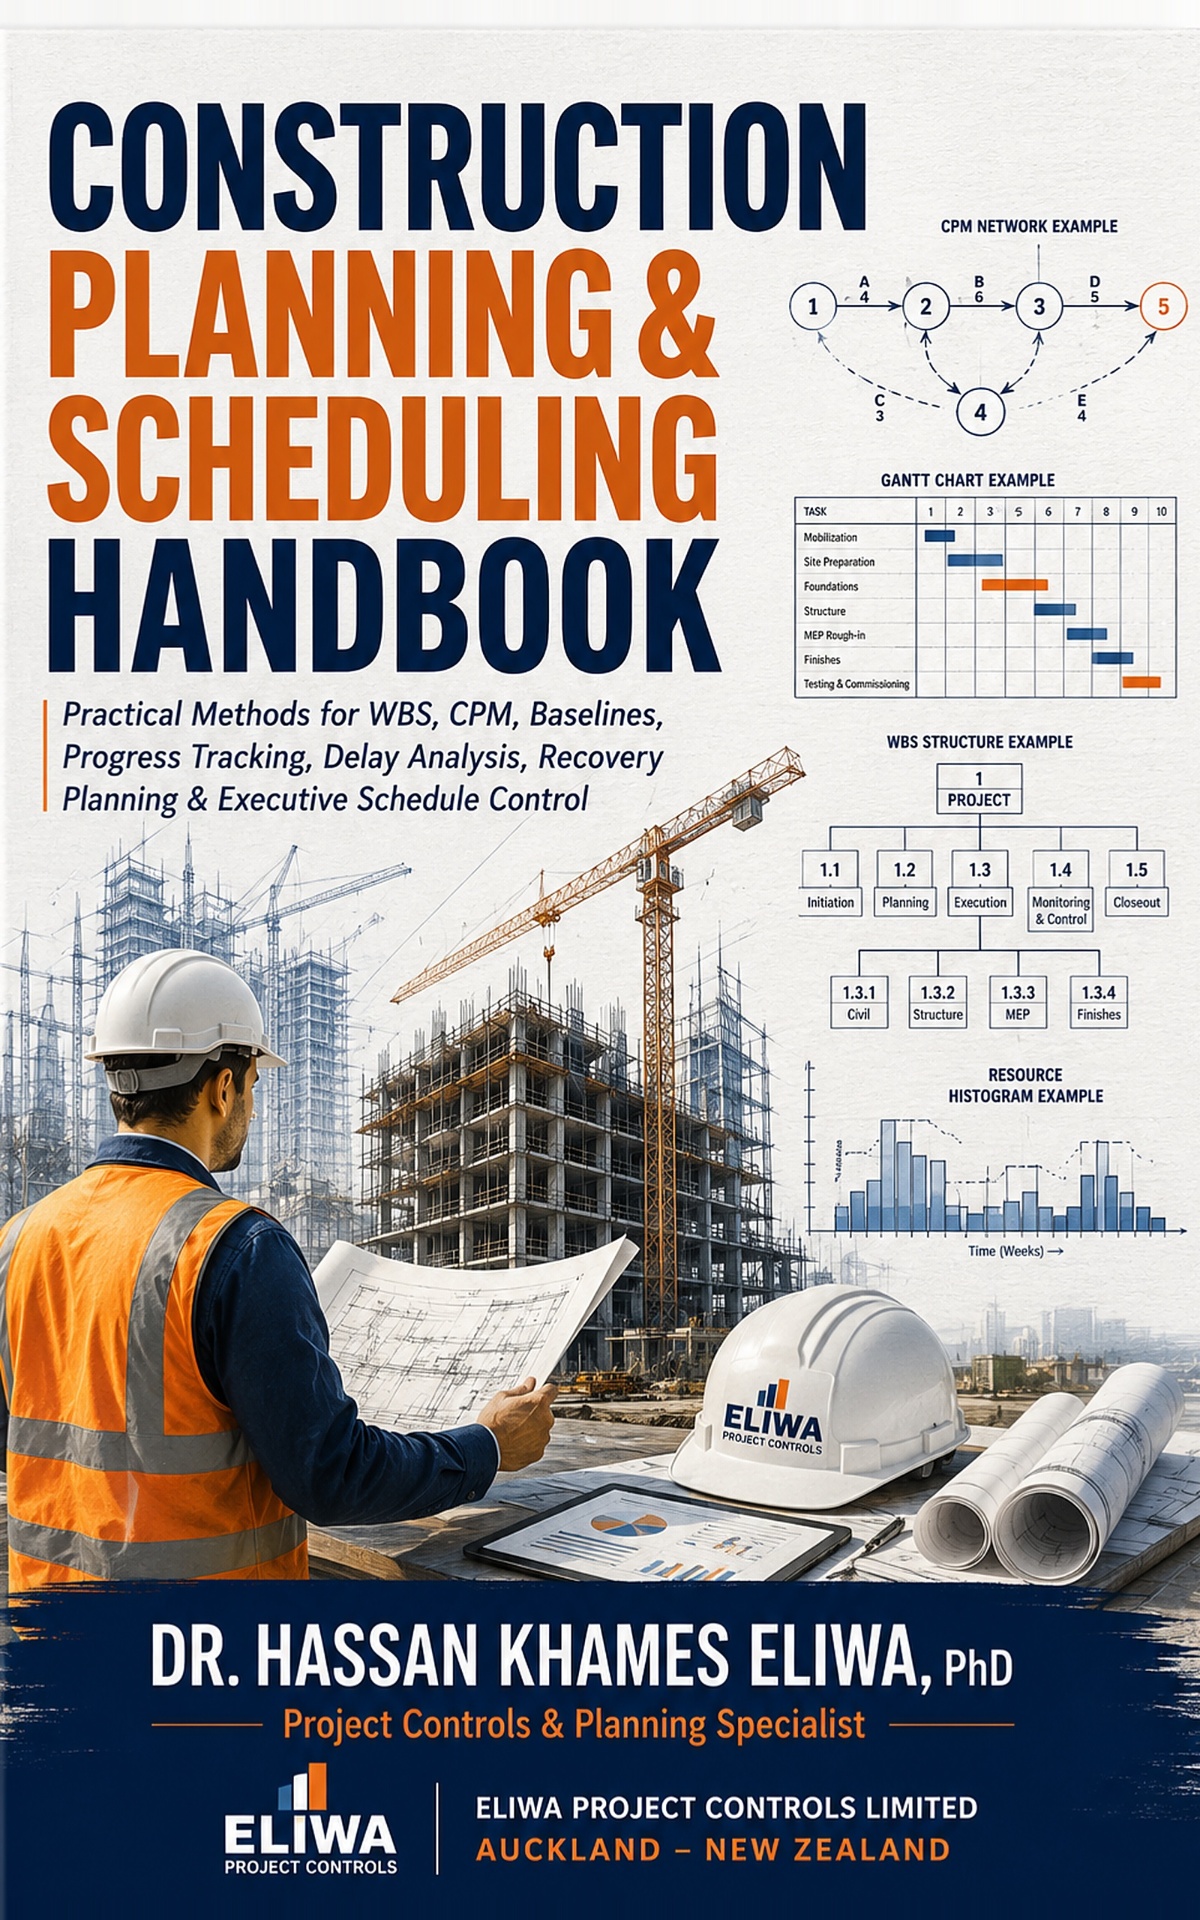
The practitioner's handbook for planning and scheduling real construction work.
PDF from $9.99 USD
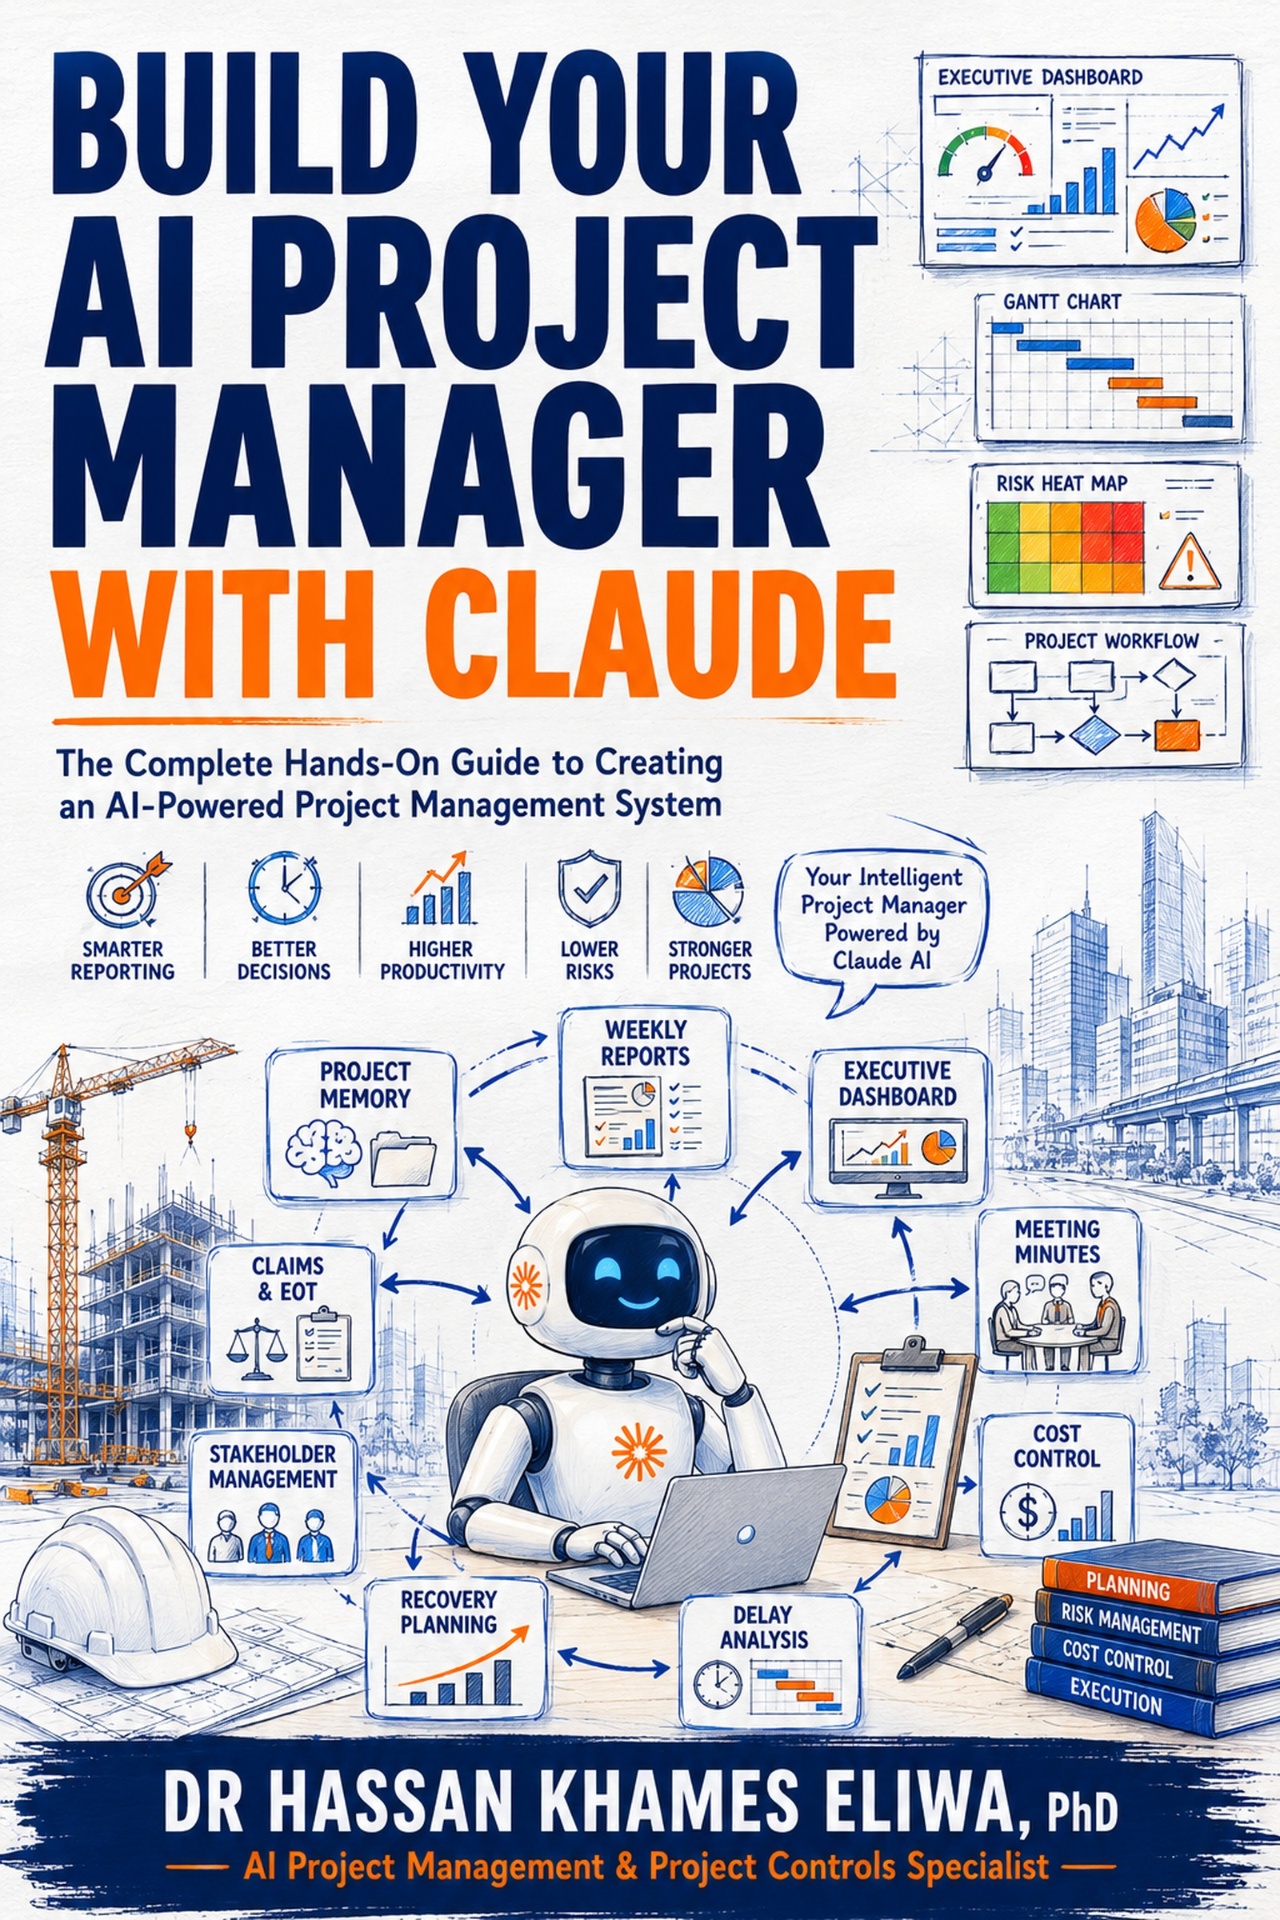
Build an AI project management system that writes your reports for you.
PDF from $9.99 USD
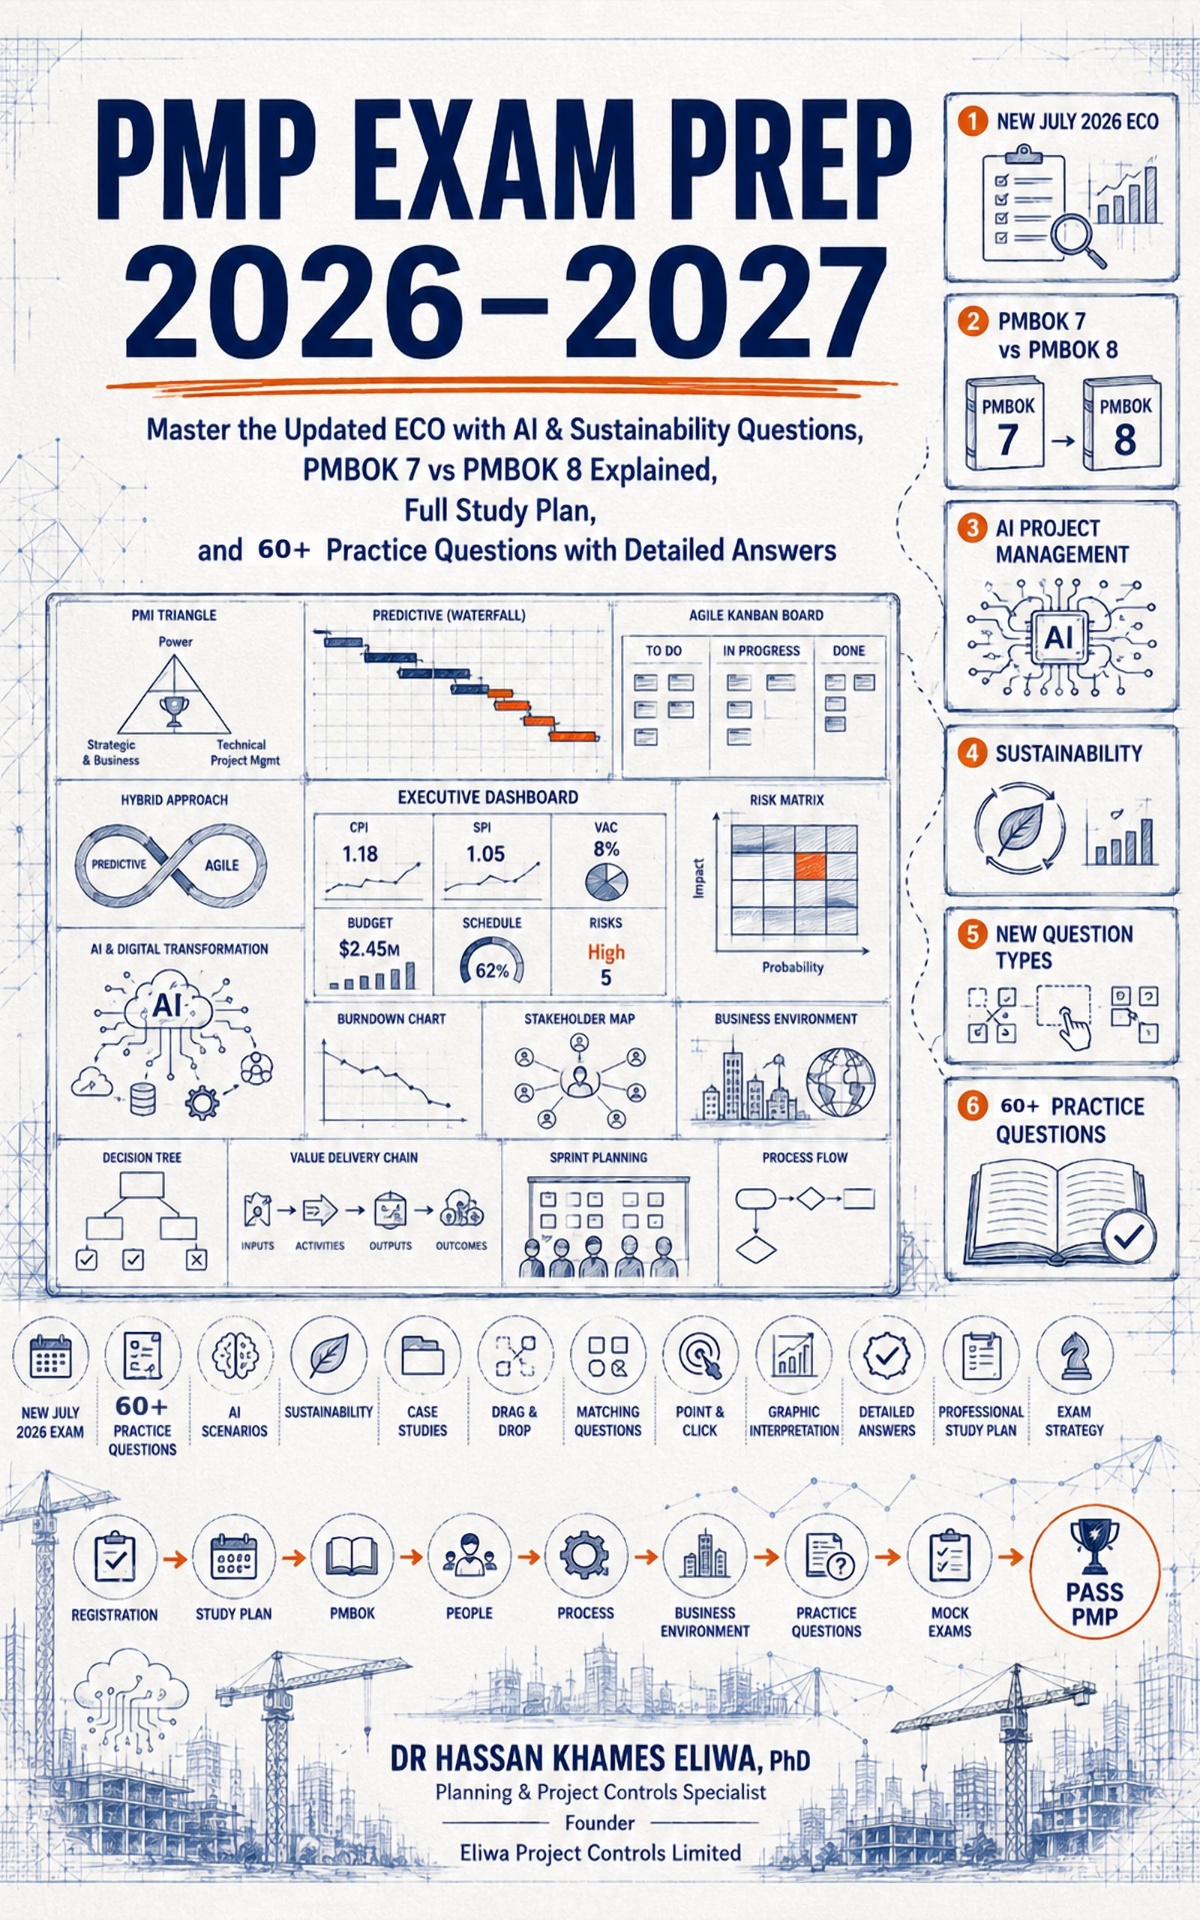
The first complete study guide for the new July 2026 PMP exam.
PDF from $12.99 USD