Construction Controls: Productivity, Variations, Subcontractor Scoring and Field-Level Reporting

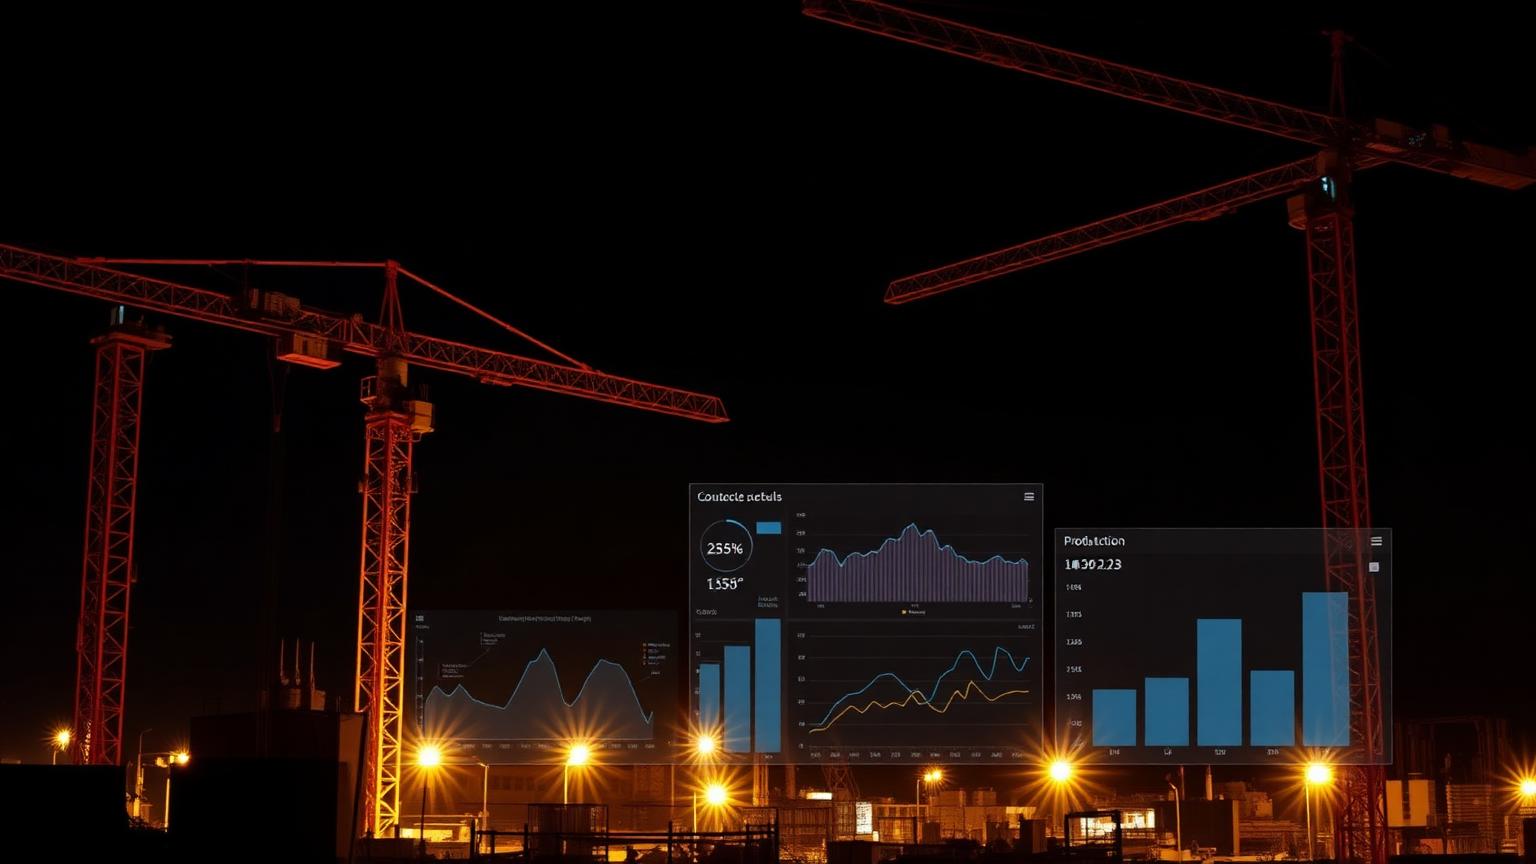
What makes construction controls different
Construction projects share the same controls fundamentals as any other capital project, but the operating environment is harsher. Work happens outdoors, weather matters, subcontractors and suppliers form a long chain, variations are constant, and the cost base is dominated by labour and materials whose productivity can swing with morale, weather or sequencing.
These conditions push controls toward two things: simpler measurements that can survive site noise, and tighter feedback loops between the site and the office. A perfectly elegant earned value system that no foreman can update is worth less than a rougher system that produces a credible weekly snapshot.
Measuring physical productivity
Productivity is the heartbeat of construction controls. It is usually measured as units of work per labour hour — cubic metres of concrete poured, tonnes of steel erected, metres of pipe welded — against a benchmark from the estimate or from industry data.
Tracking productivity at the work-package level reveals trends long before they appear in EVM. A discipline that runs 80% of benchmark for three weeks in a row is signalling something the site team should investigate: sequencing, supervision, weather or design clarity. That investigation is far more actionable than a single CPI number.

Variation orders without losing the budget
Variations are inherent to construction. The question is not how to avoid them but how to track them without losing visibility of the underlying performance. A robust variation register captures originator, technical justification, cost and schedule impact, contractual status and approval state.
Critically, variations should be reported alongside base scope rather than absorbed into it. Mixing approved variations into the baseline obscures the original deal and makes performance impossible to assess. Most cost overruns on construction projects are not a single bad event; they are the cumulative result of unmanaged variation activity.
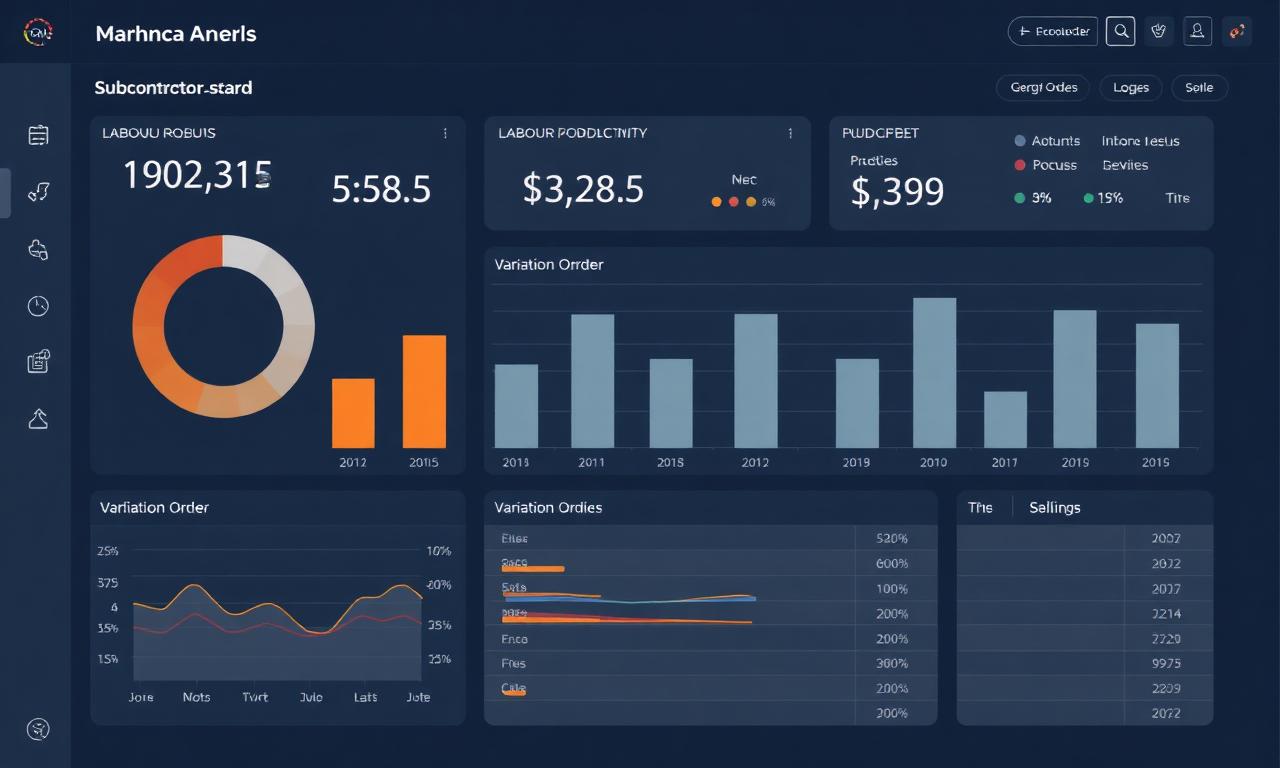
Subcontractor scorecards
On most modern construction projects, the main contractor manages a portfolio of subcontractors more than it self-performs. Subcontractor scorecards convert qualitative impressions into measurable performance: schedule adherence, productivity against quote, quality non-conformances, safety record and commercial behaviour.
Used well, scorecards drive better behaviour on the current project, inform procurement decisions on the next one, and create a data-backed basis for difficult commercial conversations. Used badly, they become bureaucracy. The difference is whether the scorecard data actually shapes decisions.
Field-level reporting
Site reports must be fast, simple and honest. Daily reports capture weather, manpower, equipment, work performed, deliveries and incidents. Weekly reports summarise progress against the look-ahead, track open issues and trigger any escalation. Monthly reports roll up into the project board pack.
The discipline that makes this work is consistency rather than volume. A short, identical-format report every week builds a record that supports forecasting, dispute resolution and lessons learned. Long, irregular reports drown the controls team and tell the project board nothing.
Integrating site data into EVM
EVM in construction is most credible when EV is earned from physical progress measured on site rather than from time elapsed or from financial draw-downs. Quantity surveying disciplines integrate naturally with this approach: measured quantities at the data date become the basis for percent-complete by work package, and EV flows directly from those quantities.
This integration is what turns construction EVM from a head-office exercise into a tool the site team trusts. When the foreman recognises the numbers, the system works. When the numbers feel disconnected from what they see, the system is quietly bypassed.
Common construction controls pitfalls
The most common failures in construction controls are not analytical. They are organisational. Quantity surveying and planning teams operating in silos. Variation registers that are six weeks behind. Productivity data collected but never analysed. Subcontractor scorecards that no one reviews. Each of these failures is solvable by simple, repeatable cadence — not by better software.
A construction controls function that works tends to feel quiet: weekly cycles run on time, numbers tie out, surprises are rare, and conversations with the site are about what to do next rather than about what the data says happened.
The weekly rhythm that keeps the site honest
The most effective construction controls systems are built around a weekly rhythm. Quantities are measured at the same cut-off, labour hours are reconciled against the same work packages, variations are triaged before they age, and subcontractor issues are escalated while they are still recoverable. The rhythm matters because construction sites move too quickly for monthly reporting to be the first line of control.
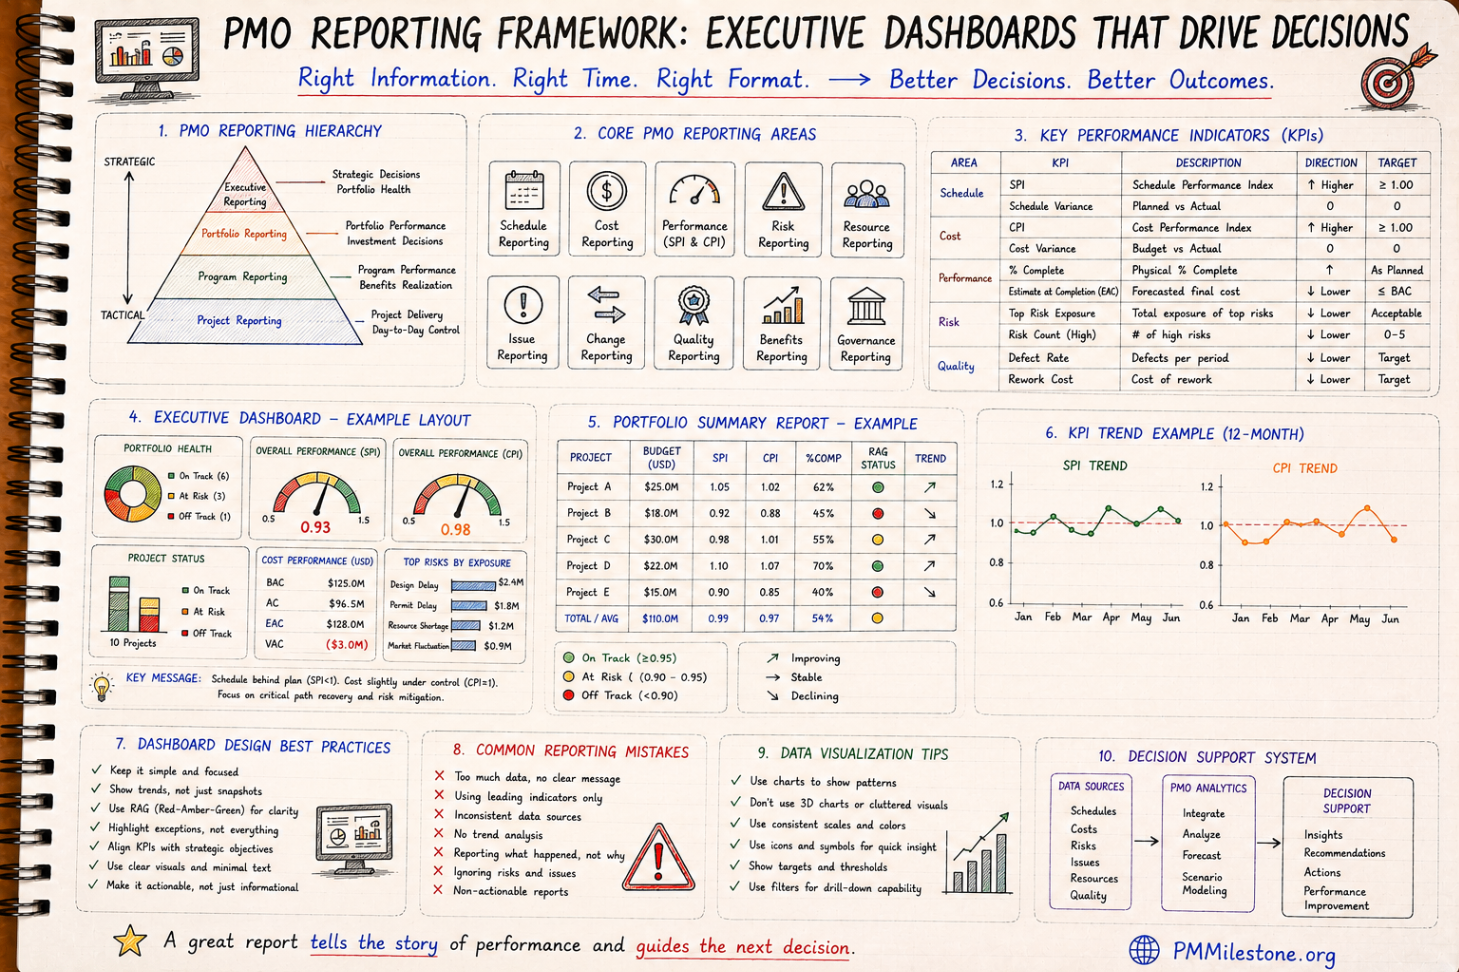
A good weekly pack is not long. It shows planned versus actual quantities, productivity trend, key constraints, approved and pending variations, safety or quality blockers, and the decisions required from the project manager. When that pack is discussed with the site team rather than emailed into a void, controls becomes part of delivery instead of a parallel reporting bureaucracy.
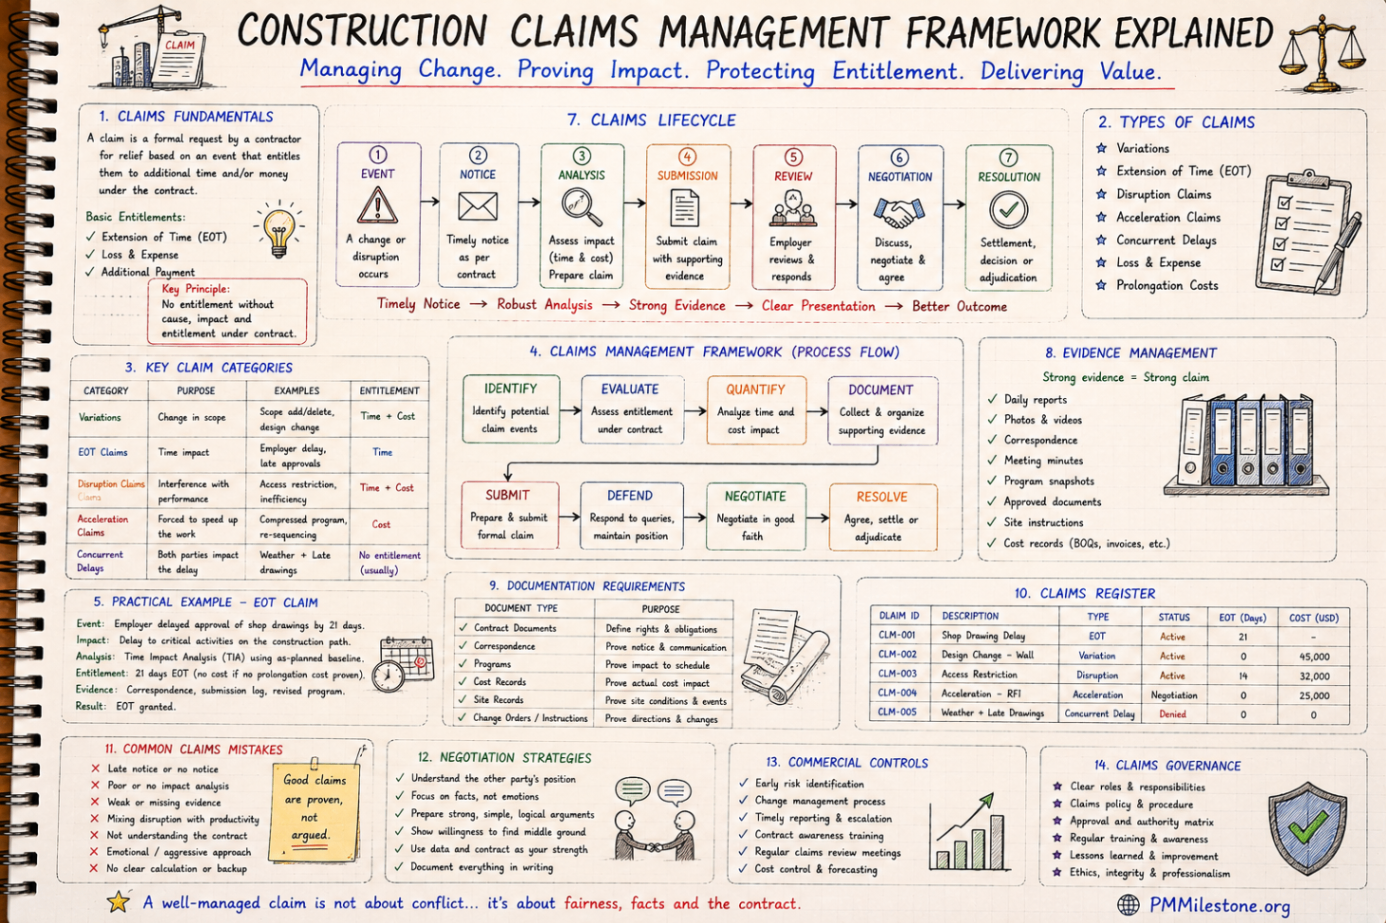
The best site teams also protect the language of the report. They distinguish installed quantity from claimed progress, approved variation from potential variation, recoverable delay from excusable delay, and productivity loss from simple under-resourcing. Those distinctions may sound small, but they prevent commercial disputes later and give the project manager a cleaner basis for action during the week itself.
Next steps on PMMilestone
Use these pages to deepen the topic, verify terminology, compare real cases and move from theory into applied project controls practice.
Related calculators
Open the calculators referenced in this article and run them against your own project numbers.
Other learning tracks
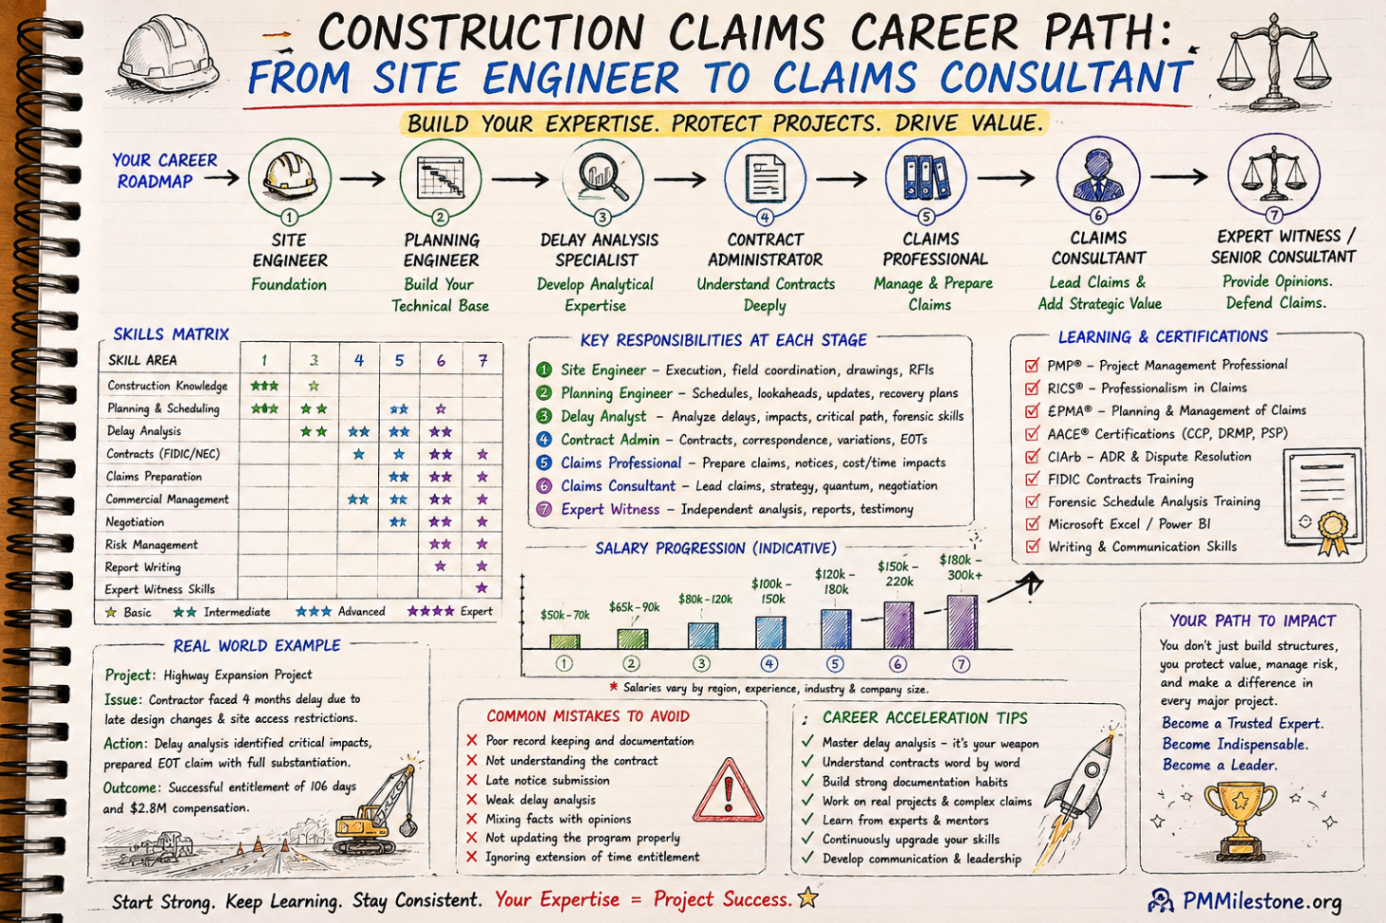
Construction Claims Career Path
A practical roadmap for engineers moving from site delivery into planning, delay analysis, claims, commercial controls and senior claims consulting.
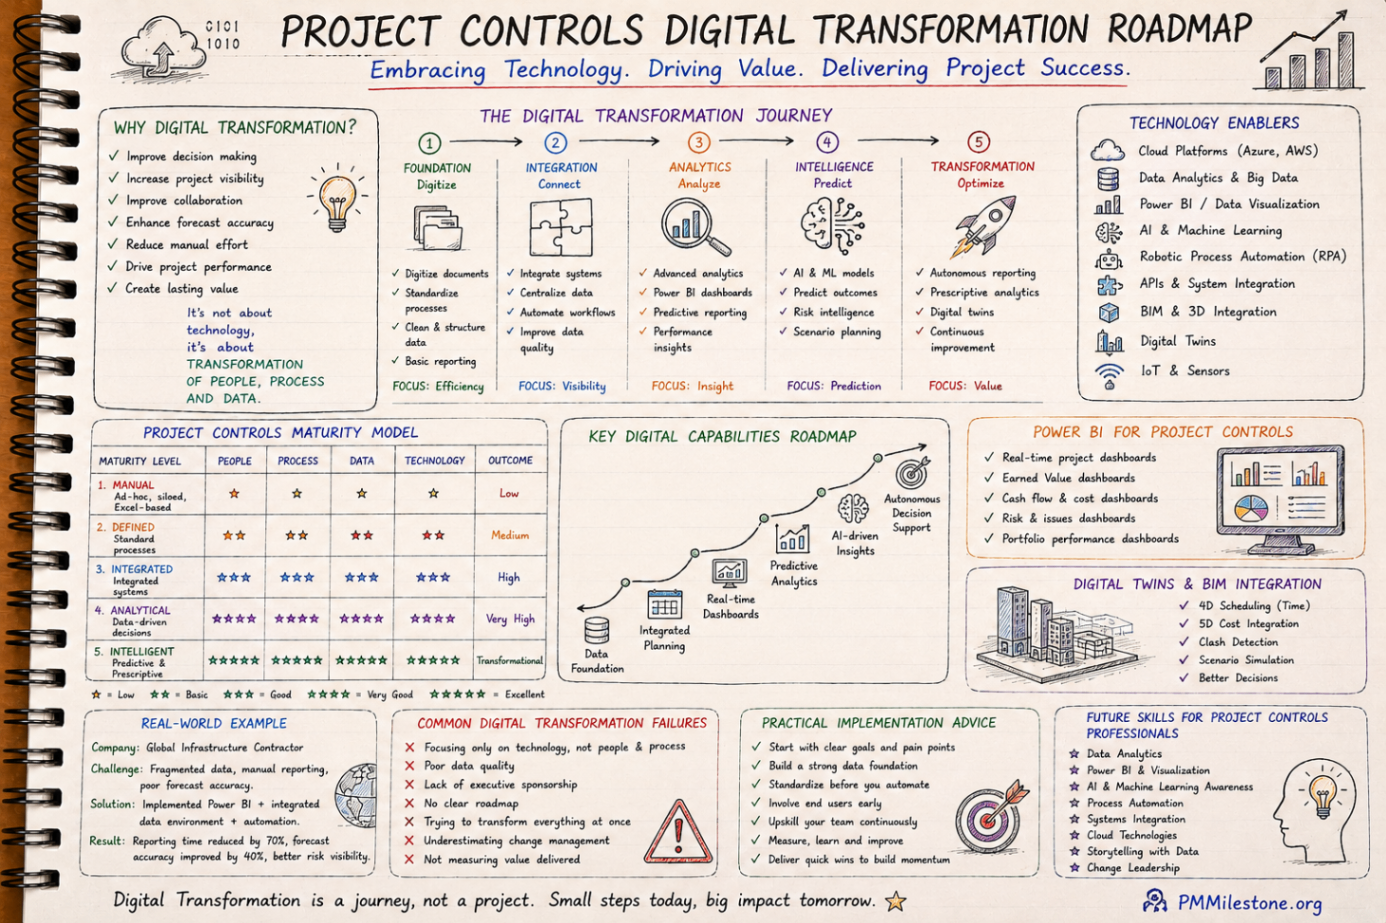
Project Controls Digital Transformation Roadmap
A future-focused guide to modern project controls through data integration, reporting automation, Power BI, AI, BIM and digital PMO capability building.
Project Controls Fundamentals
Scope, schedule, cost, risk, quality and reporting — the six disciplines that hold every successful capital project together, taught from first principles.