Planning and Scheduling: From Baseline to Critical Path, Float Erosion and Recovery

A schedule is a model, not a calendar
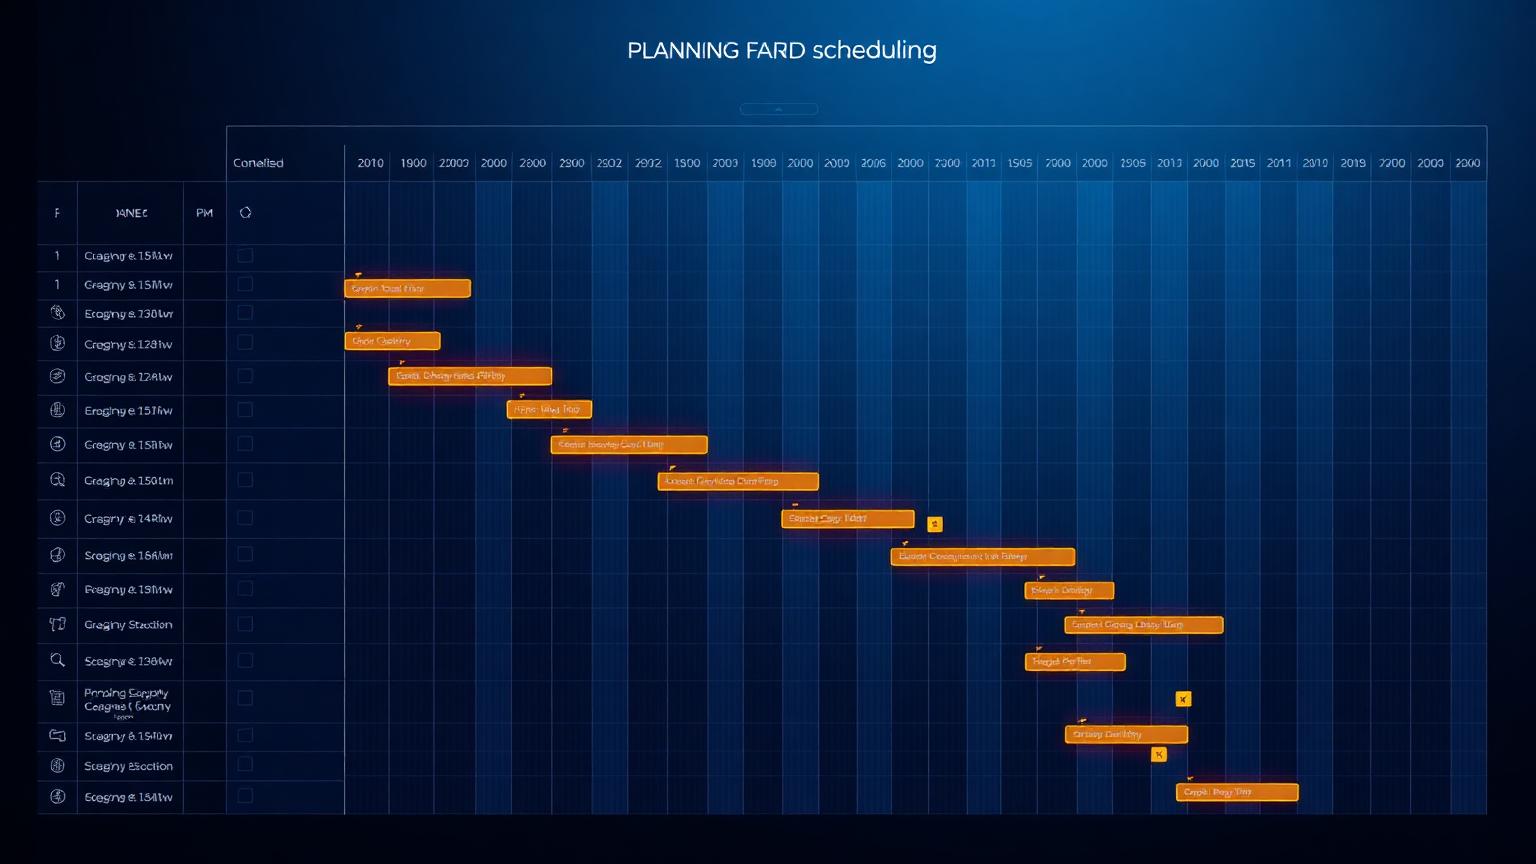
Most schedule failures begin with a category error: treating the schedule as a calendar of dates rather than a logical model of how the work fits together. A calendar can be wrong without being broken. A model, by contrast, has internal logic — predecessors, successors, constraints, resources — and you can interrogate it.
Good planners treat their schedule the way an engineer treats a stress model: change an input, watch the consequences ripple, and learn something about the project. This is the mindset every planning standard, from PMI's Practice Standard for Scheduling to AACE's recommended practices, ultimately points at.
Building a defensible baseline
A baseline is the contract between the schedule and the rest of the controls system. It should be built bottom-up from the WBS, with activity durations derived from realistic productivity rates, dependencies that reflect physical and contractual logic, and resources loaded only where they will actually be tracked.
Avoid the classic anti-patterns: open-ended activities, hard constraints used to force a date, summary-level logic, and lag values used to hide missing activities. A baseline that survives audit is one where every date can be explained by the network rather than by the planner's intent.
Critical path and float
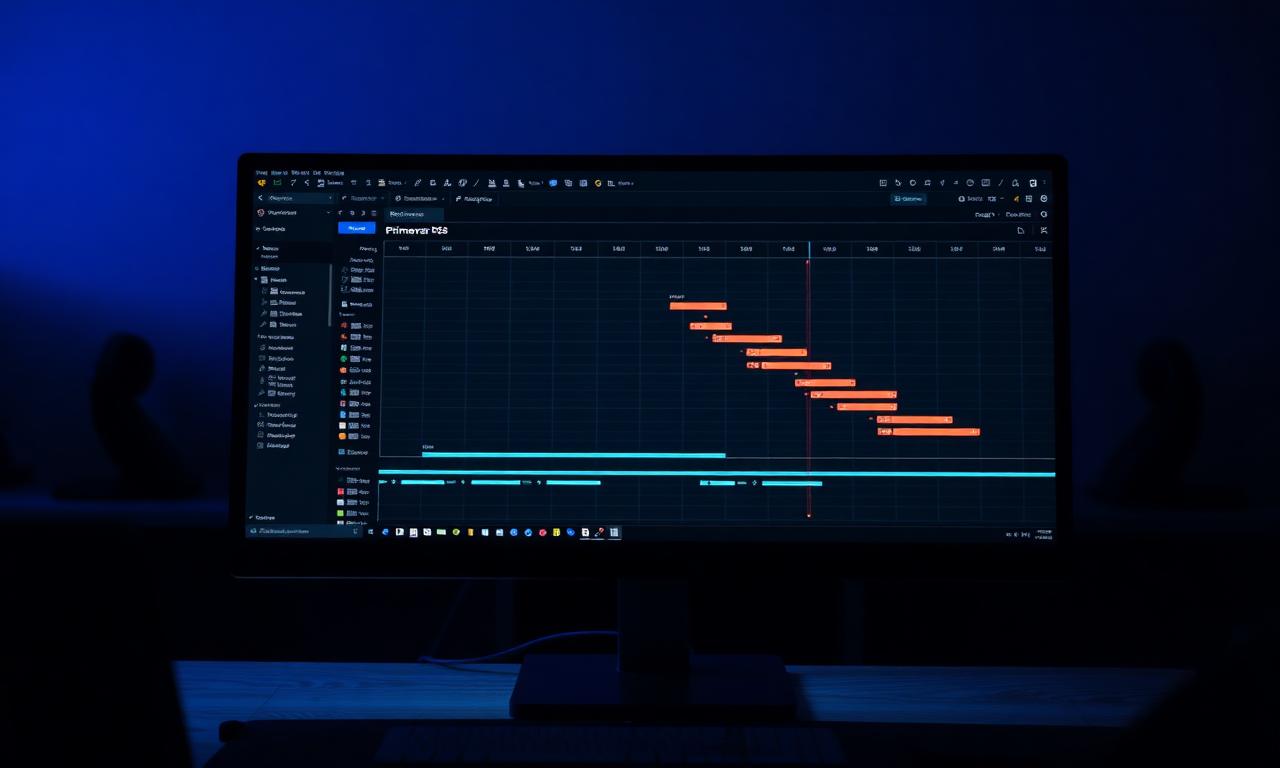
Critical path method (CPM) identifies the longest chain of dependent work through the network. That chain — and only that chain — drives the project end date. Activities on the critical path have zero total float; activities off the path have positive float and therefore some tolerance for delay.
Float is the most underrated number in a schedule. It tells you where the network is fragile, where buffers exist, and where the next slip will appear. Watching how float migrates across updates is often more informative than watching the headline finish date.

Float erosion: the silent killer
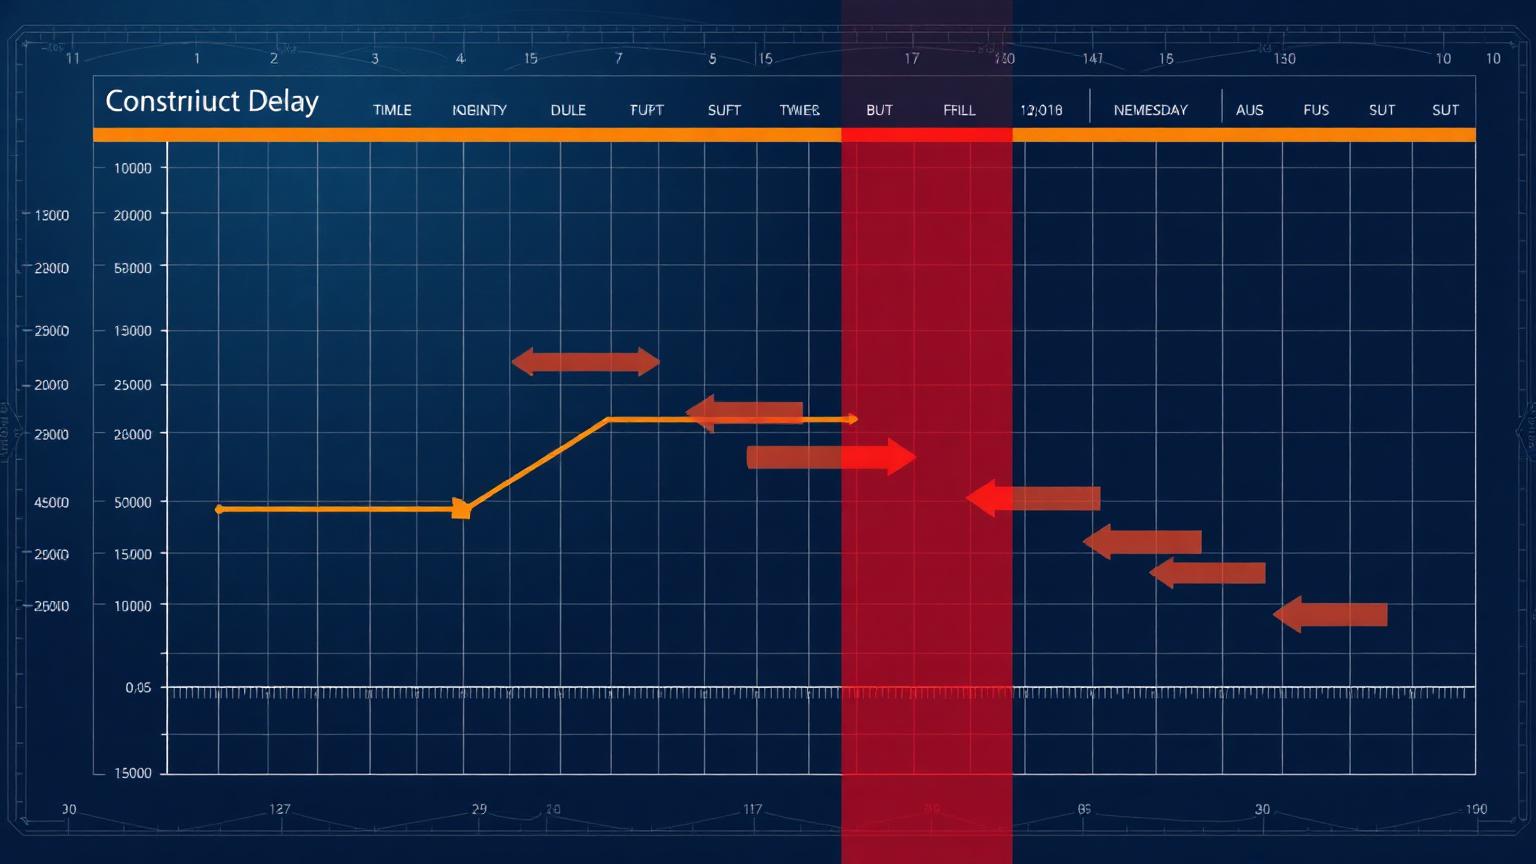
On most failing projects there is no single dramatic slip. Instead, total float erodes month after month — twenty days here, ten days there — until the schedule has no resilience left. By the time the headline date moves, the project has already lost its ability to absorb surprises.
A simple discipline prevents this: report total float distribution every update, flag activities that have lost more than a defined threshold of float, and treat float erosion as a leading indicator on equal footing with SPI and CPI.
Schedule risk and Monte Carlo analysis
Deterministic schedules give a single date; reality gives a distribution. Schedule risk analysis runs the network thousands of times with probabilistic durations to produce a confidence curve for the end date. The result is not a single number but a range, with a probability that the project will finish by each date.
Pairing schedule risk analysis with the risk register is one of the highest-value moves a controls team can make. It converts a qualitative risk discussion into a quantitative forecast and gives the project board defensible language for setting schedule contingency.
Recovery schedules and acceleration
When a project is behind, the response is rarely simply to work harder. Effective recovery schedules combine sequencing changes, additional resources, scope deferral and explicit risk acceptance. They are written as a separate plan against an agreed recovery objective, not as a quiet re-baseline that hides what happened.
Acceleration techniques include fast-tracking (running activities in parallel that were originally sequential) and crashing (adding resources to critical path activities). Both have side effects — rework risk for fast-tracking, productivity loss for crashing — and a good controls professional models the trade-off before recommending either.
Forensic delay analysis
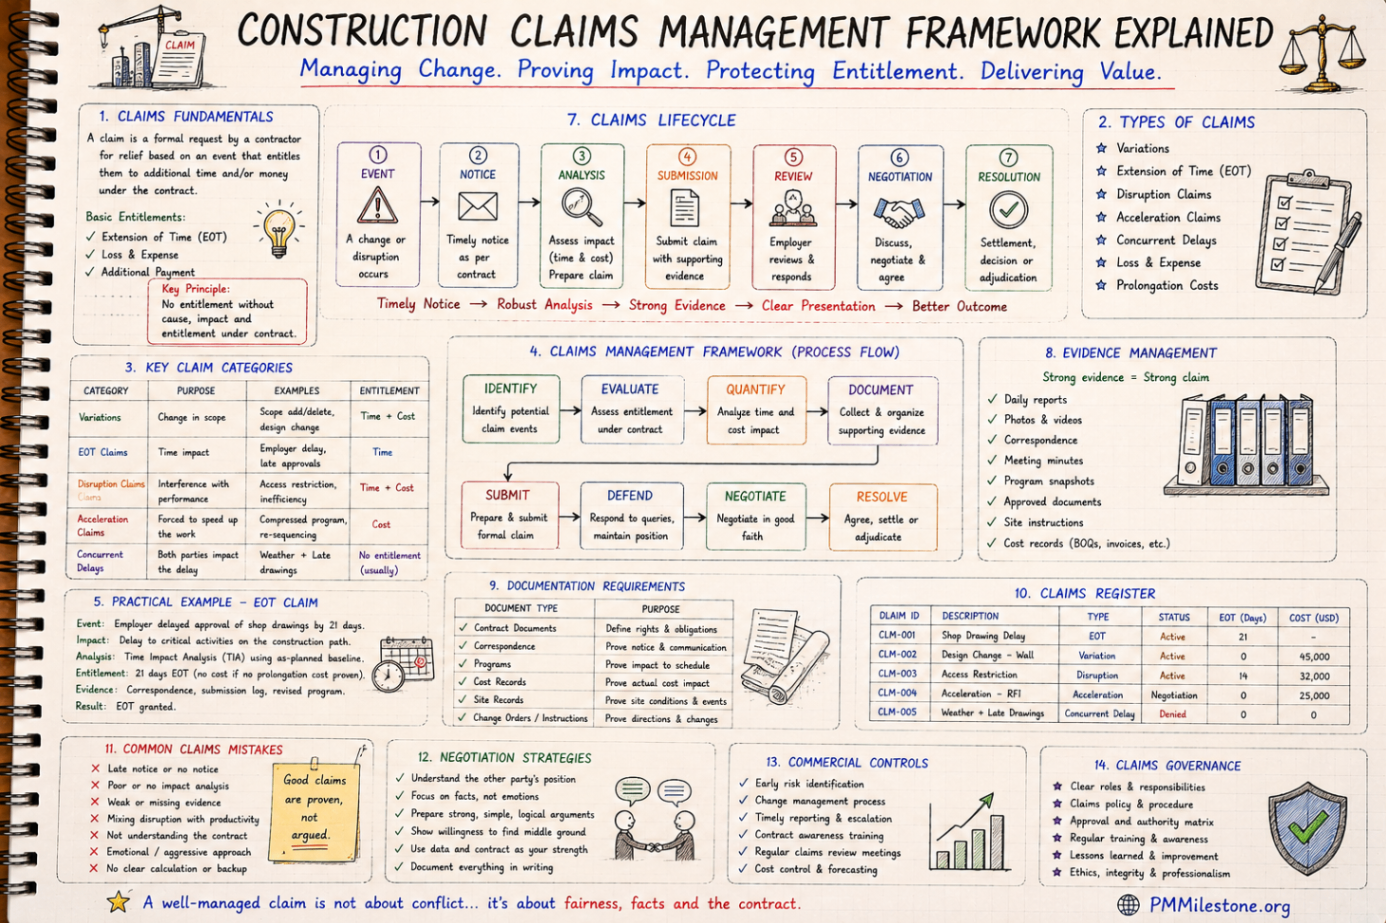
When projects end in dispute, the schedule becomes evidence. Forensic delay analysis applies methodologies such as time-impact analysis, as-planned versus as-built, and windows analysis to assign delay responsibility. The most important asset in any dispute is not the methodology but the underlying record: clean schedule updates, archived baselines and a clear change log.
Even on projects that never end in litigation, forensic-grade record-keeping pays back. It forces the kind of update discipline that prevents disputes in the first place and makes every lessons-learned exercise sharper.
What experienced planners look for every update
A professional schedule review is not a hunt for pretty bars. Experienced planners scan for three things: whether the logic still represents the way the work will actually be built, whether float is moving in ways the team can explain, and whether the next reporting period contains decisions that must be made now rather than after the delay becomes visible. That habit turns a schedule update from administration into project intelligence.
The practical cadence is simple. Compare the current critical path with the baseline critical path. Review near-critical paths, not only the single longest path. Check constraints, out-of-sequence progress and negative float before presenting dates to leadership. Then translate the technical findings into plain recommendations: protect this interface, accelerate this package, remove this approval bottleneck, or accept the new date and re-plan honestly.
Next steps on PMMilestone
Use these pages to deepen the topic, verify terminology, compare real cases and move from theory into applied project controls practice.
Related calculators
Open the calculators referenced in this article and run them against your own project numbers.
Schedule Variance (SV) Calculator
Measure schedule variance in dollars.
Open Earned ValueSPI Calculator
Schedule Performance Index — measure schedule efficiency.
Open ScheduleFloat Erosion Analyzer
Track total float consumed on critical paths.
Open ScheduleDelay Impact Calculator
Estimate the financial impact of project delays.
OpenOther learning tracks
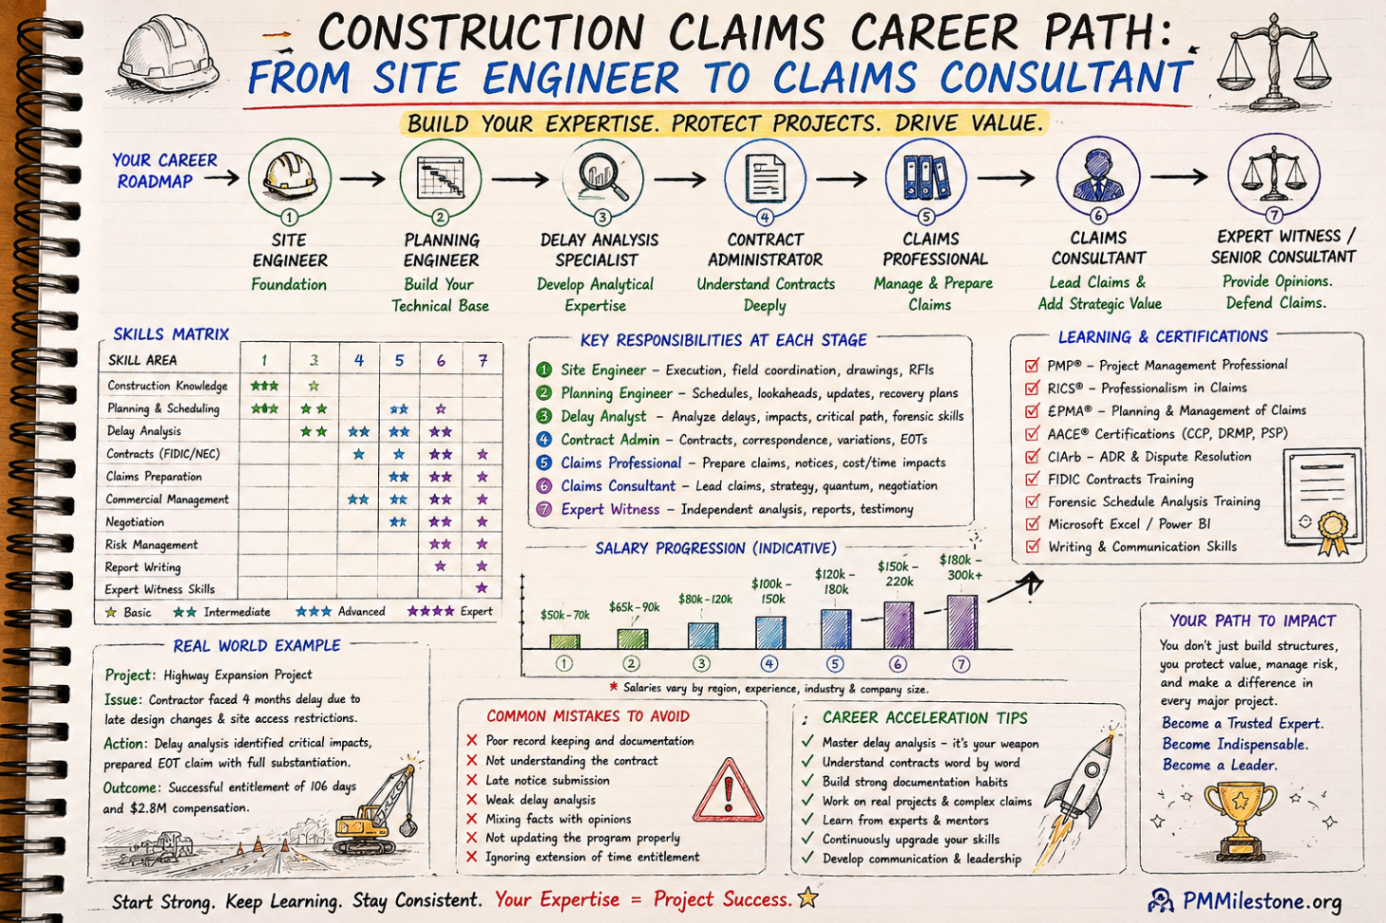
Construction Claims Career Path
A practical roadmap for engineers moving from site delivery into planning, delay analysis, claims, commercial controls and senior claims consulting.
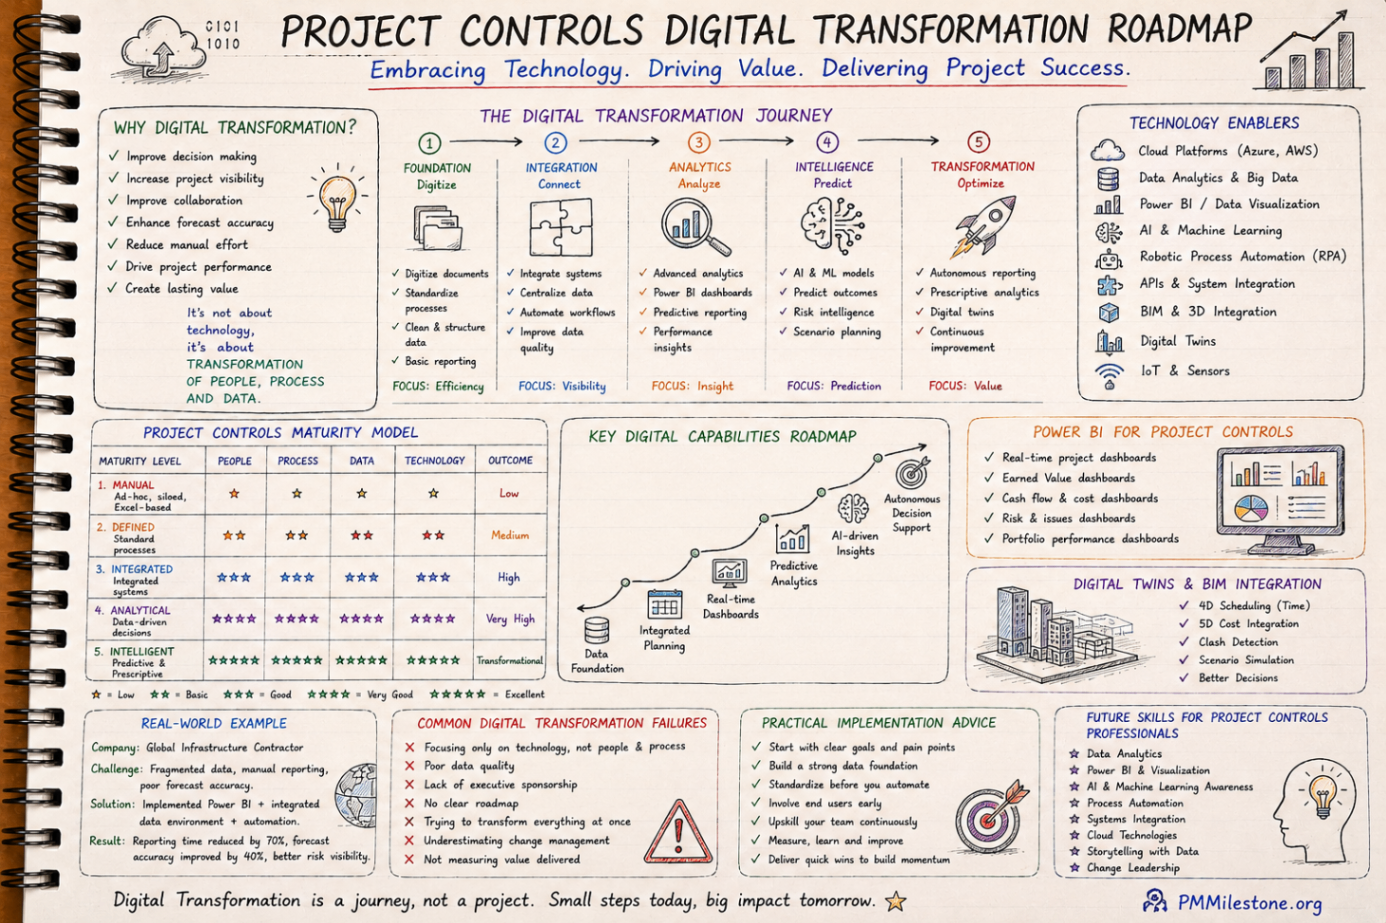
Project Controls Digital Transformation Roadmap
A future-focused guide to modern project controls through data integration, reporting automation, Power BI, AI, BIM and digital PMO capability building.
Project Controls Fundamentals
Scope, schedule, cost, risk, quality and reporting — the six disciplines that hold every successful capital project together, taught from first principles.