Integrated Project Controls Framework Explained

What 'integrated' actually means in project controls
Every capital project has some controls: a schedule somewhere, a cost report somewhere else, a risk register maintained by someone. An integrated project controls framework is different in kind, not degree. It means the planning, cost, earned value, risk, change, reporting, forecasting, claims and governance disciplines share one structure (the WBS), one baseline, one update cycle and one version of the truth — so that a single question, 'where is this project really?', has a single defensible answer.
The test of integration is simple. Ask the planner for the completion date, the cost engineer for the forecast and the risk manager for the exposure. On a fragmented project you get three numbers built on three sets of assumptions that have never met each other. On an integrated project the three answers reconcile, because they were produced from the same data spine in the same cycle.
This pillar explains each component of the framework, how the data flows between them, where integration breaks down on real projects, and how to assess maturity. Keep the Project Controls Glossary open for terminology, and use the Fundamentals pillar first if the building blocks are new — this article assumes them.
The eight disciplines of the framework
The framework has eight interlocking disciplines. Each answers a distinct management question, produces distinct outputs and feeds the others. Weakness in any one degrades the rest — a brilliant schedule cannot compensate for an unmanaged change log, and a sophisticated risk model built on a poor-quality schedule is theatre.
| Discipline | Core question | Primary outputs |
|---|---|---|
| Planning & scheduling | When, and in what sequence? | Baseline schedule, updates, critical path, float |
| Cost engineering | What will it cost? | Control budget, commitments, actuals, cashflow |
| Earned value | What did we get for what we spent? | PV, EV, AC, CPI, SPI, variances |
| Risk management | What might change the outcome? | Register, quantified exposure, contingency basis |
| Change control | What has changed, and at what cost? | Change log, impact assessments, baseline revisions |
| Forecasting | Where will this land? | EAC/ETC range, schedule forecast, confidence |
| Reporting | Who needs to decide what? | Dashboards, monthly reports, escalations |
| Claims & governance | Are commitments and entitlement protected? | Records, notices, gate evidence, decision logs |
The data spine: one WBS, one baseline, one truth
Integration is achieved through structure before software. The Work Breakdown Structure is the spine: every schedule activity, every cost account, every risk, every change and every progress measurement maps to the same WBS elements. When that mapping holds, schedule and cost data can be joined automatically, earned value falls out of the join, and a variance can be traced from an executive dashboard down to the work package that caused it.
The baseline is the second integrating artefact. Scope, schedule and cost are baselined together, at the same moment, on the same assumptions — and changed only together, through formal change control. Projects that re-baseline the schedule without re-baselining cost (or vice versa) immediately lose the ability to measure performance honestly, because earned value compares against a plan that no longer describes the commitment.
The third element is a common update cycle. All disciplines status to the same data date each period. A forecast assembled from a schedule cut on the 25th, costs cut on the 30th and risks reviewed last quarter is not an integrated position; it is a collage.
The monthly control cycle: from plan to performance to decision
The framework runs on a repeating cycle. Progress and actuals are collected against the data date; the schedule is updated and quality-checked; earned value is calculated per control account; risks and changes are reviewed; forecasts are rebuilt; and the integrated position is reported with explicit decisions requested. The cycle typically runs monthly at programme level, with weekly tactical updates beneath it.
Discipline in the cycle matters more than sophistication in the tools. A modest toolset run on a strict cadence with honest data beats an advanced platform fed inconsistently. The cycle is also where integration is enforced in practice: the cost engineer cannot finalise a forecast before the schedule update lands, and the reporting lead cannot publish until risk and change reviews close.
Quality gates inside the cycle are what keep the outputs defensible. Before earned value is calculated, the schedule update passes mechanical checks — logic density, out-of-sequence progress, constraint abuse, float integrity — because every downstream number inherits the schedule's defects. Before the forecast is published, progress claims are sampled against physical evidence. These checks take hours, and they are the difference between a control cycle that produces evidence and one that launders optimism.
Who runs the framework: roles and ownership
An integrated framework needs named owners, not shared intentions. The planning lead owns schedule integrity and the update calendar. The cost lead owns the control budget, actuals mapping and the forecast build. The risk lead owns the register, quantification and the contingency basis. The controls manager owns the cycle itself — the data date, the quality gates, the reconciliation between disciplines and the integrated narrative that goes to the project board. On smaller projects several of these hats sit on one head, but the accountabilities still need to be explicit.
Two ownership rules prevent most integration failures. First, no discipline publishes independently: schedule, cost, risk and forecast leave the controls function as one reconciled package or not at all. Second, the controls manager reports with enough organisational independence that bad news survives the journey to the decision-makers intact. Where controls reports through the function whose performance it measures, the framework's honesty depends on personalities — and personalities change under pressure.
Forecasting inside the framework
Forecasting is where integration pays for itself, because a credible forecast consumes every other discipline's output: schedule performance, cost actuals, earned value indices, quantified risk and the approved change log. The Estimate at Completion is presented as a family of methods rather than one number — formula-based EACs driven by CPI and SPI, plus a bottom-up re-estimate when scope or rates have moved materially. The To Complete Performance Index closes the loop by asking whether the remaining work can realistically be delivered at the efficiency the target implies.
Run the arithmetic yourself with the EAC Calculator, the ETC Calculator and the TCPI Calculator, and go deeper in the companion Project Forecasting Guide. The integrated framework's contribution is the inputs: a forecast is only as defensible as the schedule quality, progress honesty and risk quantification behind it.
The KPI hierarchy: how the framework reports itself
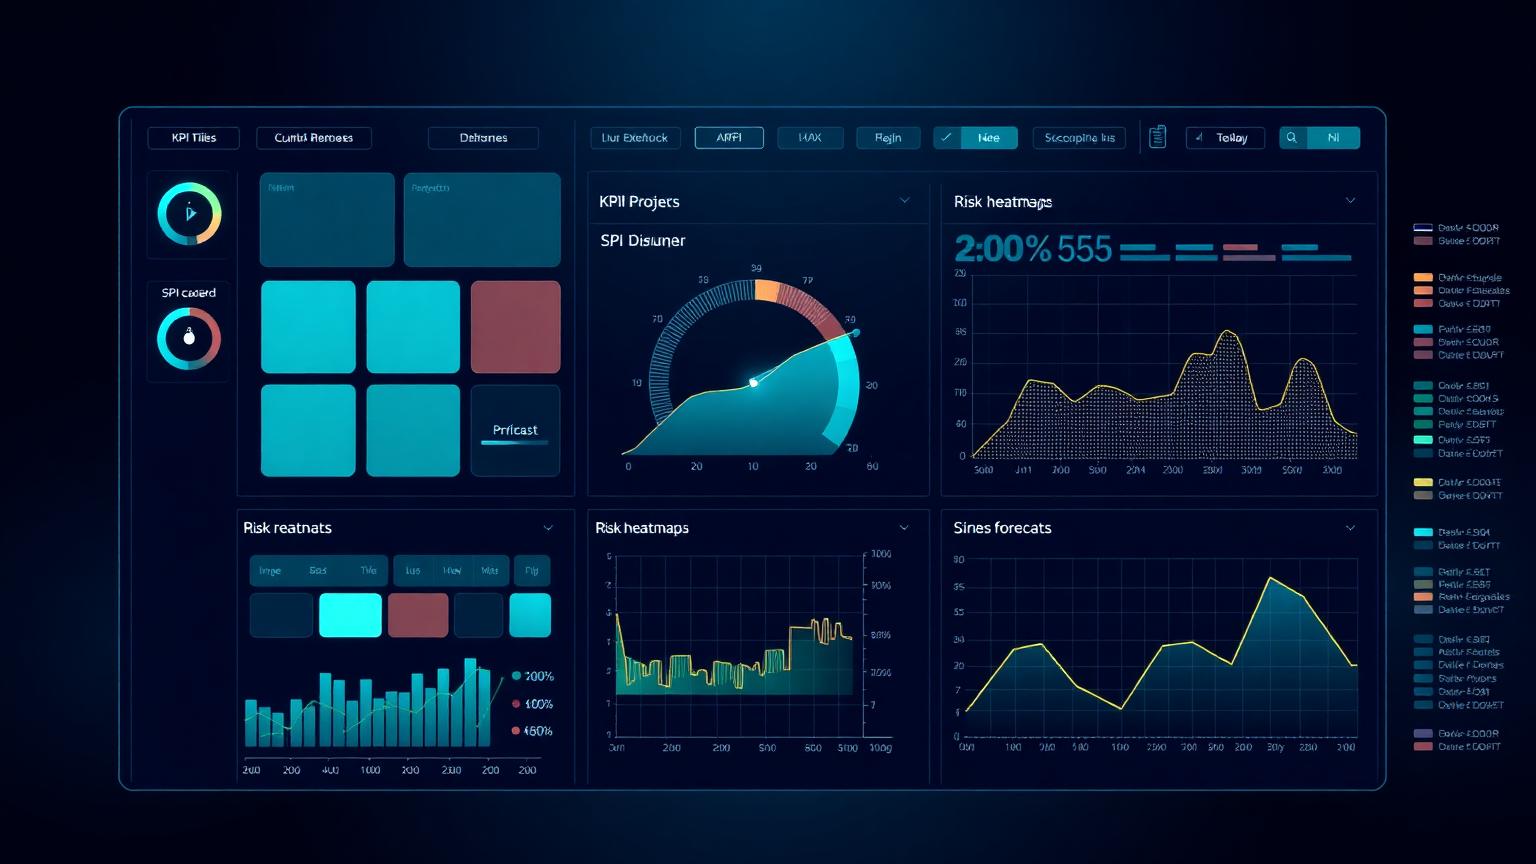
An integrated framework reports through a deliberate KPI hierarchy. At working level: schedule quality metrics, package-level CPI/SPI, float consumption, change velocity. At project level: EAC range and movement, variance drivers, contingency drawdown, top risks. At executive level: a handful of decision-grade indicators with trend and threshold — not a wall of numbers. Each level aggregates the one below it, on the same data, so drill-down never changes the story.
The companion pillar Project Controls KPIs Explained covers metric selection and thresholds in depth, and the Executive KPI Dashboard tool lets you assemble a top-level indicator set against your own project data.
Where integration fails on real projects
The failure patterns are consistent across sectors. Structural failure: schedule and cost built on different breakdowns, making earned value a manual reconciliation exercise that quietly stops happening under pressure. Baseline failure: changes absorbed informally until the baseline no longer describes the work, at which point variance analysis becomes fiction. Cycle failure: disciplines statusing to different data dates, producing a monthly report that is internally inconsistent. Ownership failure: controls treated as a reporting service rather than a decision function, so warnings are produced but nothing is decided.
The documented evidence is sobering. The Project Failure Database and the Mega Project Case Studies show the same signature repeatedly: every individual discipline existed, and the connections between them did not. Integration is not a luxury layer on top of good controls — it is the difference between controls that describe failure afterwards and controls that prevent it.
A practical diagnostic: pick one variance from last month's report and try to trace it from the executive summary down to the work package, the schedule activities and the cost transactions that produced it. On an integrated project the trace takes minutes and the story is consistent at every level. On a fragmented project the trace dies at the first manual spreadsheet join — and wherever the trace dies is exactly where the next unpleasant surprise is currently forming.
Claims and governance: the protective layer
Two disciplines protect the framework itself. Claims awareness ensures the records the framework generates — updates, notices, impact assessments, decision logs — are kept to a standard that survives commercial dispute. On contract-heavy projects this is not paranoia; it is stewardship of entitlement. The Delay Claims Library shows how often weak controls records decide disputes years after the events.
Governance ensures the framework's outputs change decisions. Stage gates consume controls evidence before capital is committed; change boards act on impact assessments; escalation thresholds turn early warnings into executive attention with defined timelines. A technically excellent framework inside a weak governance shell produces beautifully documented overruns.
The two disciplines reinforce each other in practice. A change board that demands full impact assessments generates exactly the contemporaneous records a claims position later needs; a claims-aware records culture gives governance bodies evidence instead of recollection. Projects that treat either as bureaucracy usually discover their value at the most expensive possible moment — in front of an adjudicator, or in front of a board asking why the warning signs were never escalated.
Maturity: from fragmented to integrated
Maturity grows in recognisable stages: fragmented (disciplines exist in silos, reports assembled manually), coordinated (common WBS and calendar, but reconciliation still manual), integrated (single data spine, automated EVM, one cycle), and finally decision-driven (forecast ranges, early warning thresholds and governance acting on them routinely). Most organisations sit between coordinated and integrated, and the jump across that gap returns more value than any tool purchase.
Benchmark honestly with the PM Maturity Assessment, then close gaps in order of structure, baseline discipline, cycle discipline and only then tooling. The research grounding for this staged approach is collected in the Publications library, and the PMMilestone Academy's structured Learning Tracks and Knowledge Pillars cover each discipline of the framework in depth.
Frequently asked questions
What is an integrated project controls framework?
It is the operating model that connects planning, cost, earned value, risk, change control, forecasting, reporting, claims records and governance through one WBS, one baseline and one update cycle — so the project has a single defensible answer to 'where are we really?'.
What is the difference between having project controls and having integrated project controls?
Fragmented controls produce a schedule, a cost report and a risk register that do not reconcile because they were built on different structures and data dates. Integrated controls produce the same artefacts from a shared data spine in a shared cycle, so the numbers agree and variances can be traced to their source.
Where should a project start if its controls are fragmented?
Start with structure, not software: align schedule and cost on one WBS, re-establish a joint baseline through formal change control, and enforce a single data date for all disciplines. Tooling investments pay back only after those three foundations hold.
How does earned value fit into the integrated framework?
Earned value is the bridge discipline: it prices physical progress so schedule and cost performance can be read together. It only works when progress measurement rules are fixed, the baseline is protected and both schedule and cost map to the same WBS — which is why EVM quality is a reliable indicator of overall integration.
How do I measure the maturity of a project controls framework?
Assess four stages — fragmented, coordinated, integrated, decision-driven — across structure, baseline discipline, cycle discipline and governance response. The PM Maturity Assessment on PMMilestone provides a structured benchmark and highlights which gap to close first.
Academy articles that build on this pillar
These newer Academy articles reference this Knowledge Pillar directly — continue with them to apply the concepts.
Where this article connects
Curated cross-links: related Academy articles, the Knowledge Pillars this topic draws on, and the calculators referenced in the FAQs above.
Related Academy articles
Relevant Knowledge Pillars
Calculators referenced in the FAQs
Related learning for this topic
Hand-picked Learning Tracks, Knowledge Pillars, publications and case data that extend this article.
Next steps on PMMilestone
Use these pages to deepen the topic, verify terminology, compare real cases and move from theory into applied project controls practice.
Related calculators
Open the calculators referenced in this article and run them against your own project numbers.
EAC Forecast Calculator
Estimate at Completion — forecast final project cost.
Open ForecastingETC Calculator
Estimate to Complete the remaining work.
Open ForecastingTCPI Calculator
To-Complete Performance Index — required efficiency to finish on budget.
Open Earned ValueCPI Calculator
Cost Performance Index — measure cost efficiency.
Open ReportingExecutive KPI Dashboard
Single executive KPI score 0–100.
Open PMOPM Maturity Assessment
Score PM maturity across 5 dimensions.
OpenOther knowledge pillars
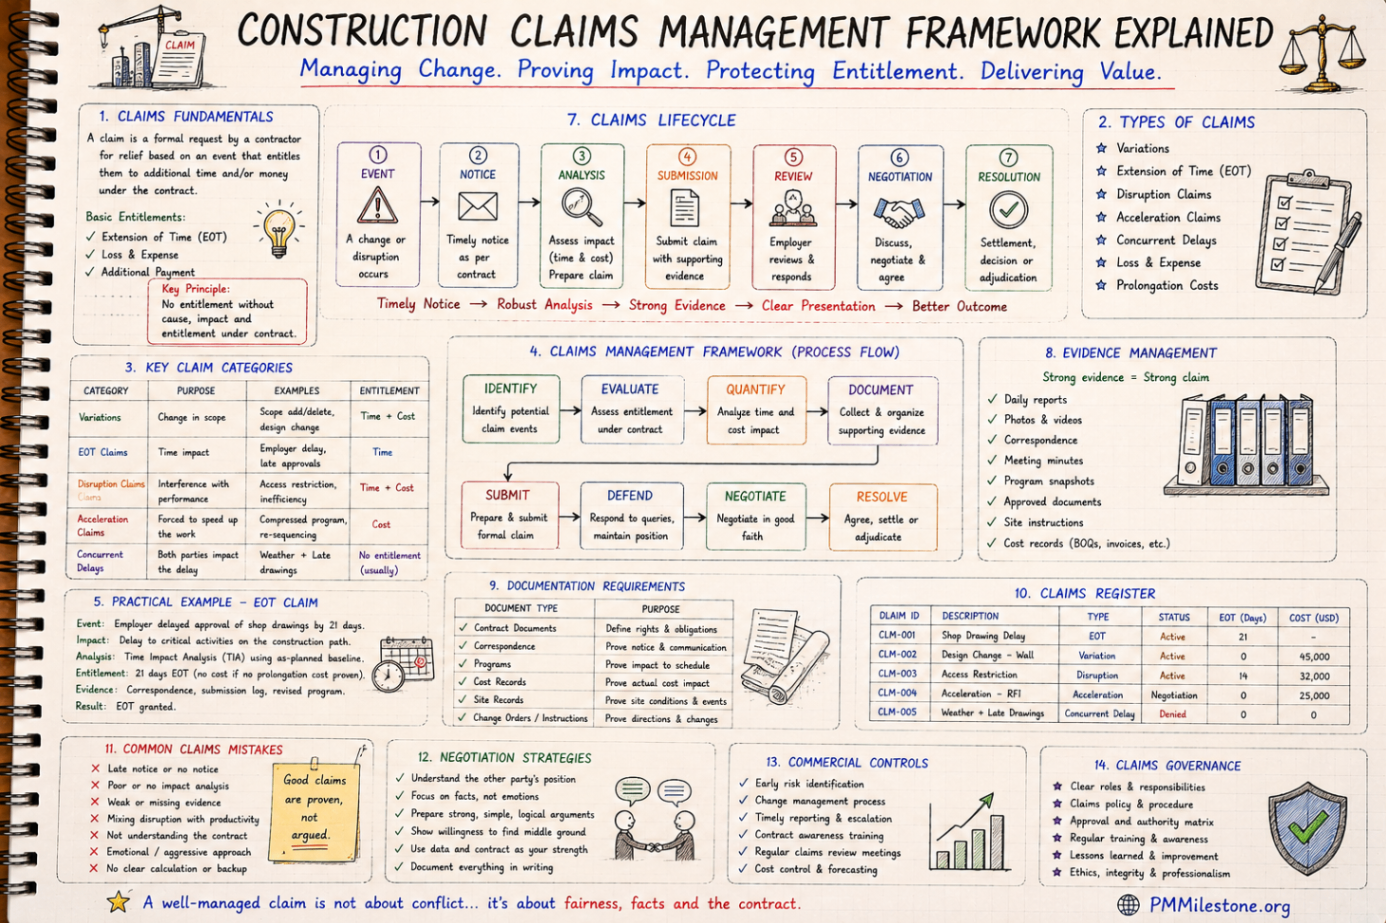
Construction Claims Management Framework Explained
A practical claims management framework for construction and infrastructure projects covering entitlement, records, analysis, negotiation and governance.
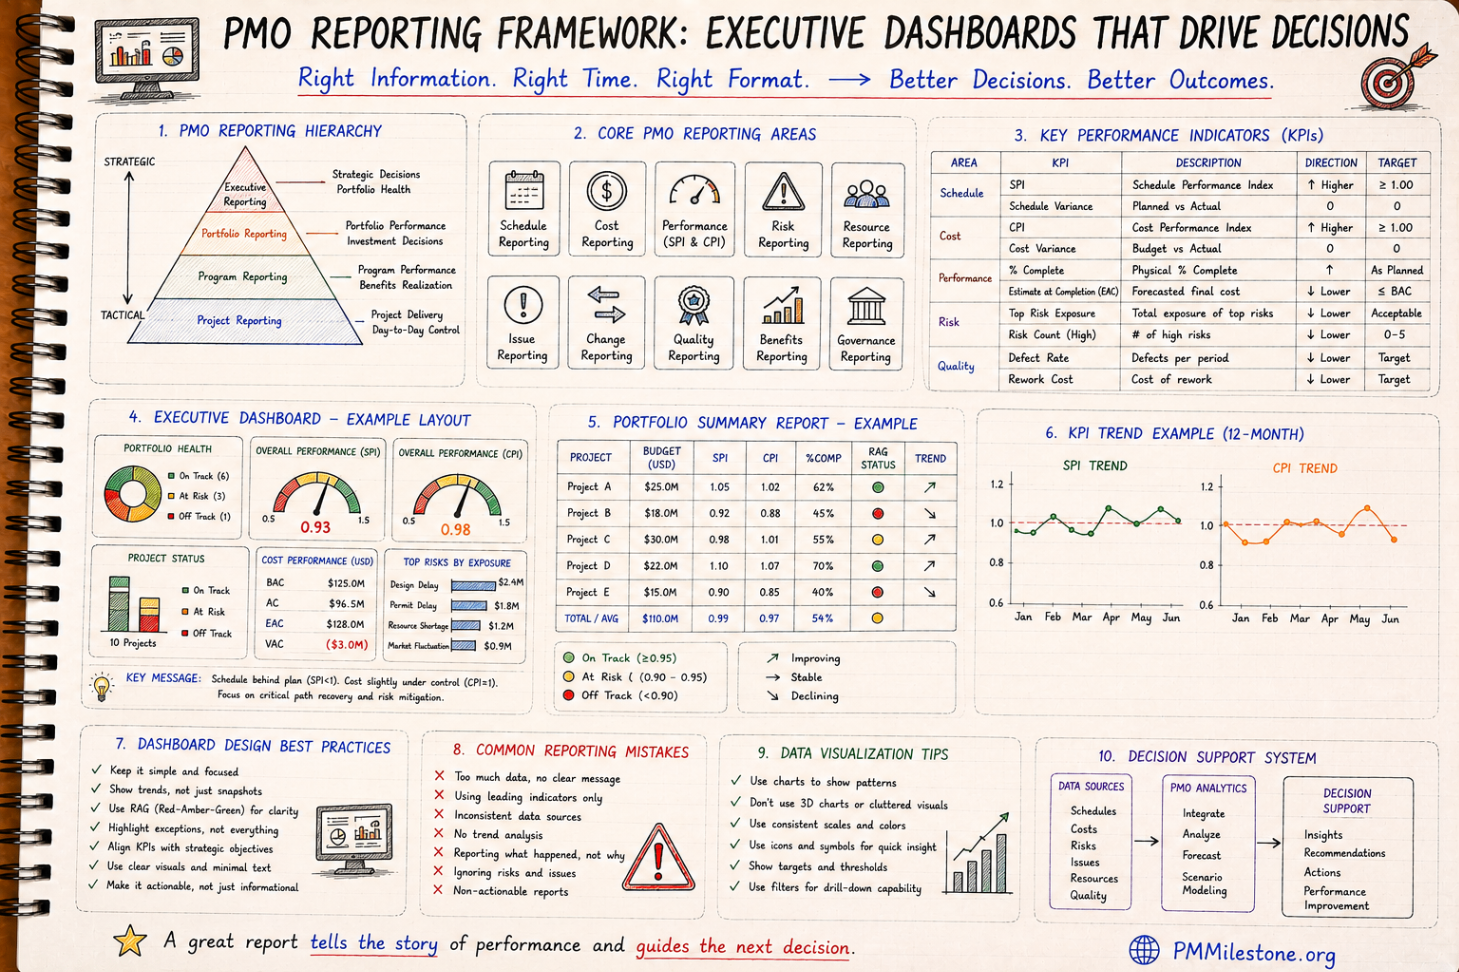
PMO Reporting Framework
A reference guide to executive PMO reporting covering dashboard structure, KPI choice, portfolio views, reporting cadence and common reporting mistakes.

Guides and Long-Form Articles
Practitioner-written explainers across EVM, planning, forecasting, risk and PMO design — read as a syllabus or as a refresher.