The Complete Earned Value Management (EVM) Framework Explained

Why EVM is misunderstood on real projects
In training rooms, EVM is often presented as a neat cluster of equations. In project review rooms, it is far messier. I have seen projects with perfect-looking CPI and SPI values that were clearly drifting toward trouble, and I have seen projects with ugly variances that were still well controlled because the team understood the story behind the numbers. The difference is whether EVM is being treated as a reporting ritual or as a decision framework.
At its best, EVM integrates scope, schedule and cost so that performance is measured objectively rather than emotionally. At its worst, it becomes a monthly spreadsheet exercise where percent complete is guessed, baselines are weak, actual costs are late, and the formulas produce a false sense of certainty. This pillar is written for the working planner, cost engineer, project controls engineer and PMO analyst who wants to use EVM as it should be used: to improve decisions on live projects.
The foundation: the three baselines that make EVM credible
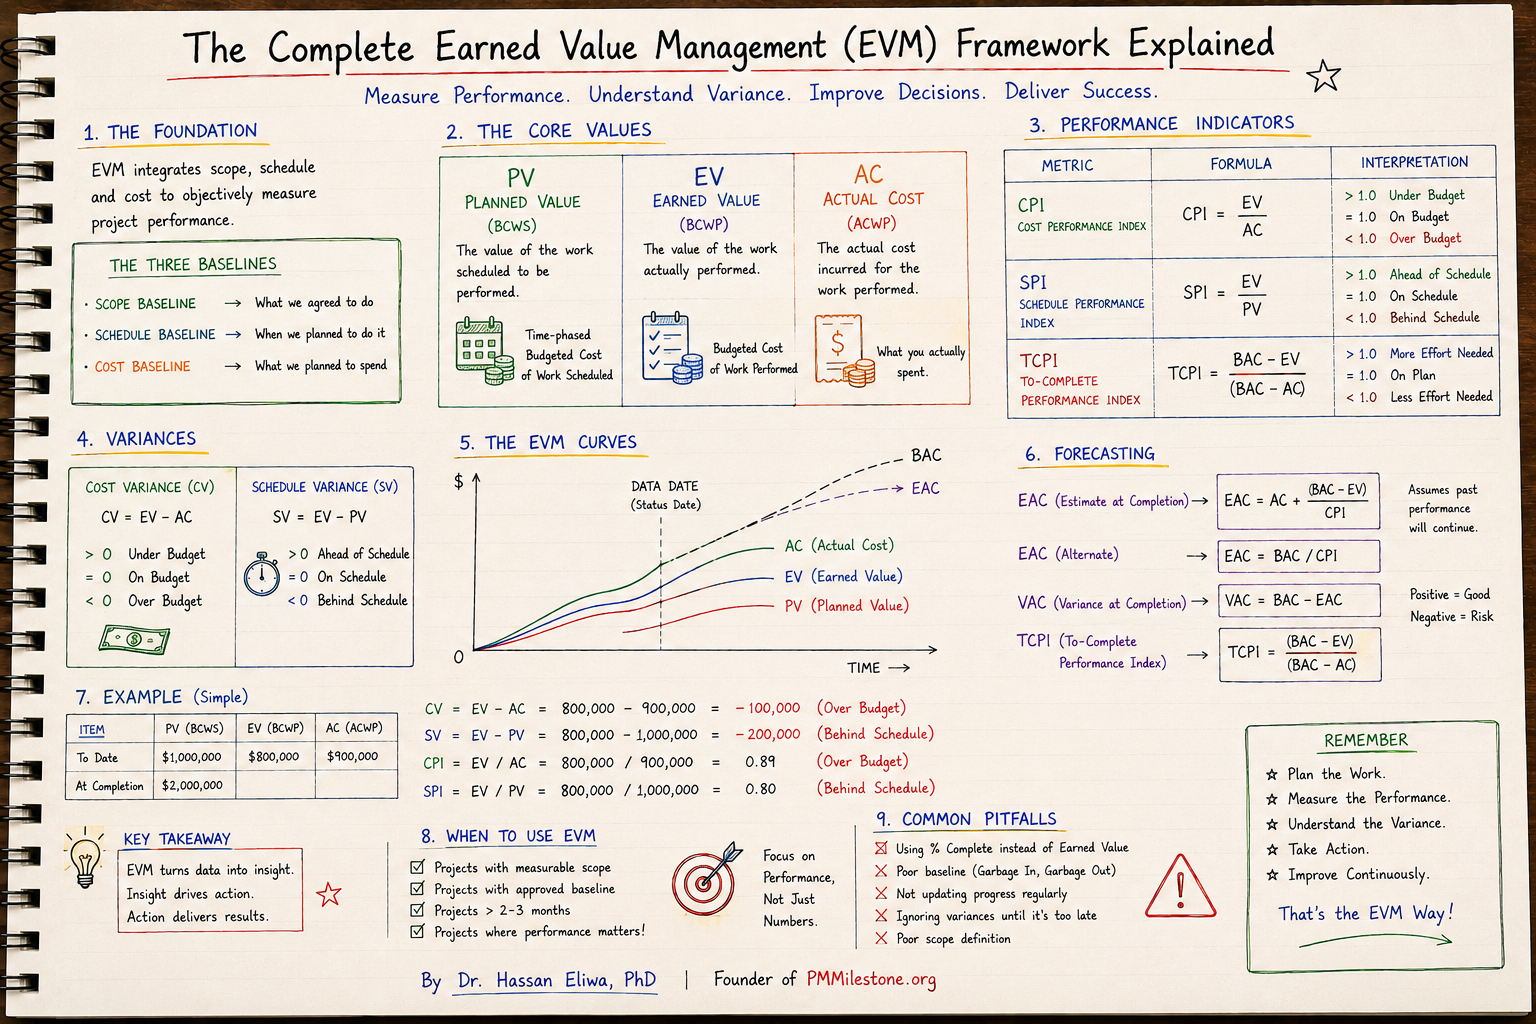
No EVM system is stronger than its baselines. The scope baseline defines what work was agreed. The schedule baseline defines when it was supposed to happen. The cost baseline defines what it was supposed to cost. If any one of the three is weak, the earned-value outputs become decorative rather than useful.
This is why EVM works best on projects with measurable scope, approved baselines and a disciplined update cadence. On a construction project that might mean concrete pours, steel erection tonnage, cable pulling metres or commissioning packages tied to a WBS and measured against a signed-off baseline. If your project is still in conceptual flux, or if scope is changing faster than it can be baselined, EVM can still help — but only if the limits are made explicit.
The three core values: PV, EV and AC
The heart of EVM is simple. Planned Value (PV, also called BCWS) is the budgeted value of the work scheduled to be performed by the status date. Earned Value (EV, or BCWP) is the budgeted value of the work actually performed. Actual Cost (AC, or ACWP) is what you actually spent to perform that work. Those three numbers, taken together, tell you whether you are delivering the planned amount of value at the planned rate and cost.
In practice, the quality of EV is what makes or breaks the system. If EV is based on lazy percent-complete guesses rather than measurable rules — 0/100, 50/50, weighted milestones, installed quantities or tested systems — the entire framework becomes unreliable. On live projects I prefer physical-progress rules linked to deliverables wherever possible, especially for civil, structural and MEP work.
Variances first: CV and SV are usually where the real conversation starts
Cost Variance (CV = EV − AC) tells you whether you are under or over budget for the work performed. Schedule Variance (SV = EV − PV) tells you whether the value of work performed is ahead of or behind what was planned by the data date. These two are often more intuitive for project managers than the indices because they are expressed in currency terms.
On a major building project, a negative CV might reflect low labour productivity during façade installation; a negative SV might reflect delayed procurement of switchgear pushing commissioning work to the right. The point is that variances should trigger questions, not end them. What happened? Is it temporary or structural? Which work packages are driving it? What corrective action is realistic?
Performance indicators: CPI, SPI and TCPI
The Cost Performance Index (CPI = EV / AC) is the efficiency ratio for money spent. Above 1.0 means you are getting more value than cost; below 1.0 means you are burning cost faster than value. The Schedule Performance Index (SPI = EV / PV) expresses schedule efficiency in the same spirit. Both are powerful because they trend well over time.
The To-Complete Performance Index (TCPI) is where many teams lose confidence because it looks abstract. It is not abstract. TCPI tells you the performance efficiency required on the remaining work to meet a target — either BAC or EAC. In plain English: how hard do we have to work from here to hit the number? A TCPI materially above 1.0 is management's warning that recovery assumptions may be unrealistic.
Reading the EVM curves: what the graph tells you that the table does not
A good EVM chart usually shows PV, EV and AC as cumulative curves, with the data date marked. This chart is one of the fastest ways to explain project health to executives because it shows both position and trend. If AC is rising above EV while EV diverges from PV, you are paying more and delivering less than planned. If EV and PV move together but both are flattening, the project may be stalled even though the indices look stable.
I always advise teams to read the curves in time sequence, not just at a single data date. Trend matters more than one month. A CPI of 0.92 that has been improving for four months tells a very different story from a CPI of 0.98 that has just collapsed from 1.05.
Forecasting: EAC, VAC and when to use which formula
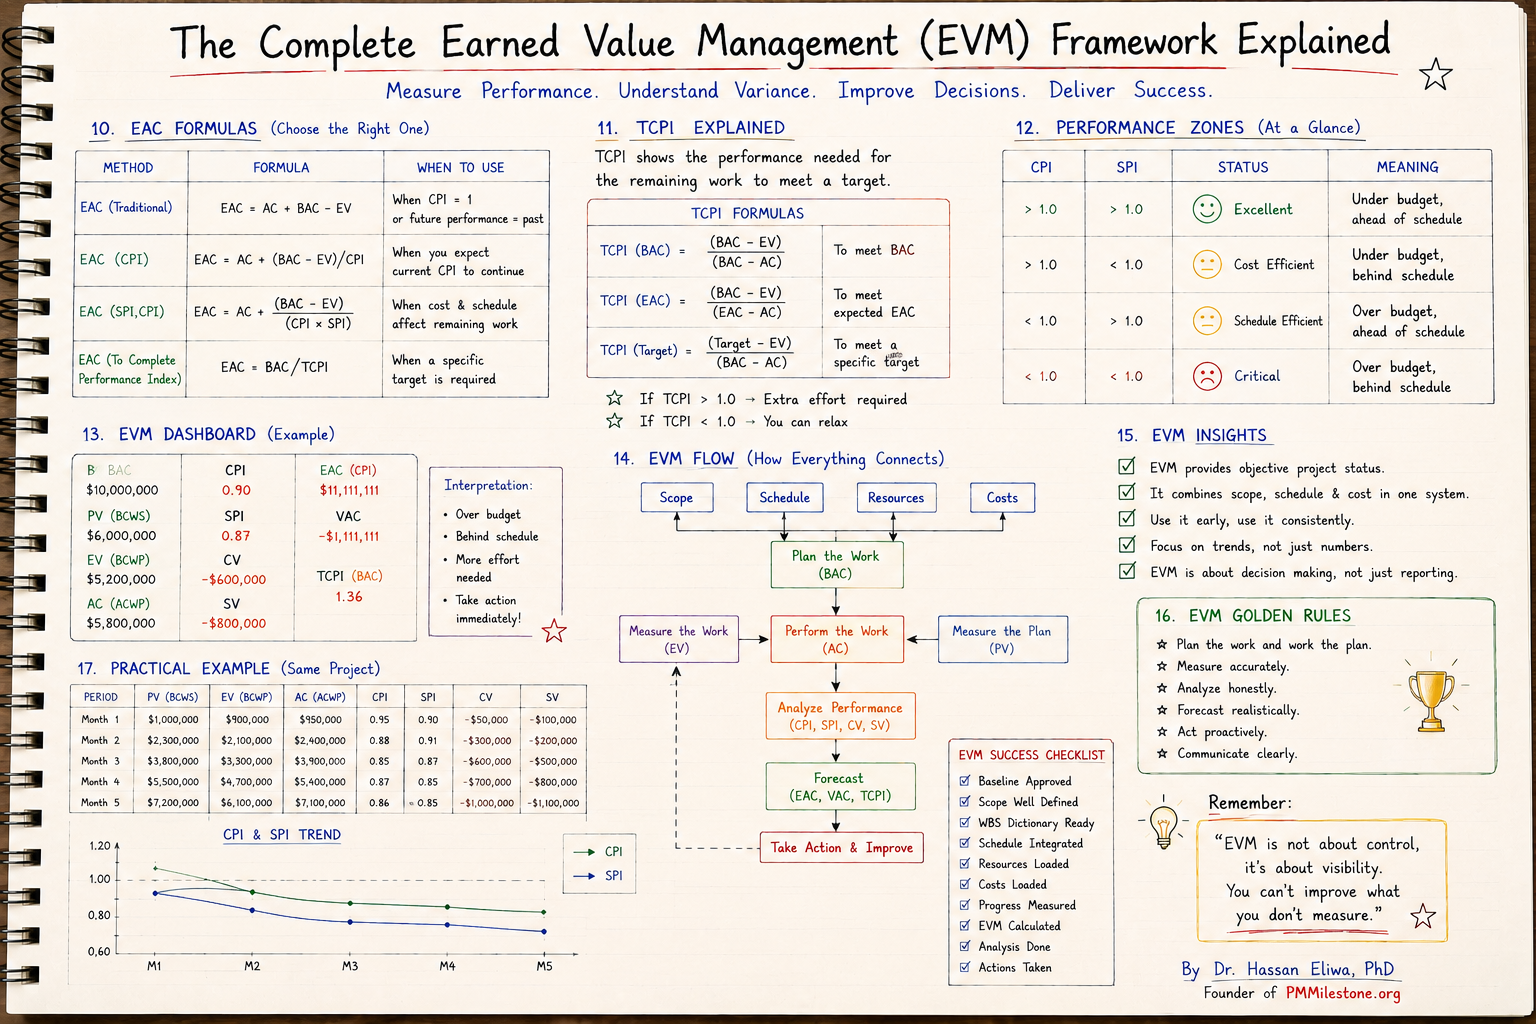
Forecasting is where EVM becomes genuinely strategic. Estimate at Completion (EAC) asks what the project is likely to cost by the end if current conditions continue or if certain assumptions are made. Variance at Completion (VAC = BAC − EAC) then expresses the likely overrun or underrun against the approved budget.
The formula you choose matters. EAC = AC + (BAC − EV) / CPI assumes current cost performance continues. EAC = BAC / CPI is a shortcut version of the same logic. When both cost and schedule performance will affect remaining work, some teams use CPI × SPI in the denominator, though I recommend using that carefully and only when schedule delay genuinely translates into additional cost. The most important rule is not mathematical elegance — it is explaining the assumption behind the forecast so decision-makers know what they are signing up to.
A practical construction example: why the indices matter
Imagine an electrical package on a hospital project. By the end of Month 5, the baseline says you should have delivered $7.2m of value (PV). Measured physical progress says you have actually earned $6.1m (EV). Actual cost is $7.1m (AC). Immediately the story is visible: CPI is below 1.0, SPI is below 1.0, CV and SV are both negative. You are over budget and behind schedule.
That is not yet an action plan — but it is the right alarm. The next step is to decompose the package: cable pulling productivity, containment completion, procurement delays, rework on terminations, access constraints by area. This is why EVM must live inside a broader controls system rather than outside it. The formulas tell you there is a problem; the schedule, cost breakdown and site intelligence tell you why.
Performance zones: when CPI and SPI combinations tell different stories
A useful management shorthand is the performance-zone view. CPI > 1.0 and SPI > 1.0 means the project is under budget and ahead of schedule — excellent, but still worth checking whether progress is overstated. CPI > 1.0 and SPI < 1.0 means cost efficient but late, often caused by slower output with lower resource burn or by procurement lag. CPI < 1.0 and SPI > 1.0 means ahead of schedule but over budget, common when teams crash the schedule. CPI < 1.0 and SPI < 1.0 is the danger zone: paying more and getting less.
These zones are useful because they force the right management response. The remedy for cost-efficient-but-late is not the same as the remedy for over-budget-but-ahead.
The EVM dashboard: what to show and what not to bury executives in
An effective EVM dashboard does not try to show every metric. For most governance forums, BAC, PV, EV, AC, CPI, SPI, CV, SV, EAC, VAC and TCPI are enough — provided they are accompanied by a short interpretation and the top three causes of movement. Add trends, not just point values. A five-period CPI/SPI trend line tells more truth than a single data-date snapshot.
Executives do not need twenty formulas. They need a clean read on whether the project is under control, where the pressure is coming from, what the most likely outturn is, and what decisions are required now. This is where the PMO Reporting & Executive Dashboards pillar connects directly to EVM.
How everything connects: EVM as a closed-loop management system
The best way to understand EVM is as a flow. Scope, schedule, resources and costs produce the baseline plan. Actual execution produces AC. Measured progress produces EV. The baseline for the data date produces PV. Variance analysis turns those into CPI, SPI, CV and SV. Forecasting turns them into EAC, VAC and TCPI. Then action is taken — resequencing, staffing changes, recovery planning, commercial action, scope challenge or contingency release. That action then changes the next cycle.
When teams skip the action step, EVM becomes sterile. When they close the loop, EVM becomes one of the most useful management systems on the project.
When to use EVM — and when not to overclaim it
EVM is strongest on projects with measurable scope, approved baselines and durations long enough for trends to matter — usually projects beyond a few months in duration. It is especially valuable on construction, EPC, shutdowns, commissioning programmes and capital works where quantities, progress milestones and budgets can be tied to a WBS.
It is weaker on highly iterative work where scope evolves rapidly and progress is not easily measurable. That does not mean it is useless in those environments — only that it must be adapted and its limitations made explicit.
Common pitfalls: the reasons EVM gets blamed for failures it did not cause
The most common pitfall is using soft percent complete instead of true earned value. The second is poor baselining — garbage in, garbage out. The third is irregular updating; monthly data on a fast-moving project is often too slow. The fourth is ignoring variances until they have hardened into outcome. The fifth is weak scope definition. I would add a sixth from experience: publishing indices without interpretation. Numbers without narrative are not management information.
These pitfalls explain most complaints that EVM 'does not work'. In reality, what does not work is low-discipline controls feeding a high-discipline framework.
Golden rules and practical lessons learned
Plan the work and work the plan. Measure accurately. Analyse honestly. Forecast realistically. Act proactively. Communicate clearly. Those six rules sound simple, but on stressed projects they are surprisingly rare. My own lesson learned is that EVM should be introduced early and used consistently. Teams that wait until the project is in trouble almost always implement it badly because they are trying to reconstruct discipline under pressure.
The best EVM systems are boring in the best possible way: clear baseline, clean progress rules, regular updates, brief commentary, visible trends and timely action. That is what authority looks like in project controls.
Frequently asked questions
What is the biggest mistake teams make with EVM?
Using guessed percent complete instead of measurable earned-value rules. If EV is weak, every downstream metric becomes suspect.
Can EVM work on small projects?
Yes, but keep it light. The project still needs measurable scope, a baseline and regular updates. On very small jobs, a simplified version is often enough.
Is SPI enough to judge schedule health?
No. SPI should be read alongside the schedule logic, float erosion, milestone slippage and, where appropriate, earned schedule or critical-path analysis.
Which EAC formula should I use?
Use the formula whose assumption matches reality. If current cost efficiency is likely to continue, CPI-based EAC is sensible. If remaining work will behave differently, adjust the assumption and explain it clearly.
What does TCPI really tell management?
It tells you how efficient the remaining work must be to hit BAC or EAC. If the required efficiency is unrealistic, the target probably needs to change or corrective action must intensify.
Academy articles that build on this pillar
These newer Academy articles reference this Knowledge Pillar directly — continue with them to apply the concepts.
Next steps on PMMilestone
Use these pages to deepen the topic, verify terminology, compare real cases and move from theory into applied project controls practice.
Related calculators
Open the calculators referenced in this article and run them against your own project numbers.
SPI Calculator
Schedule Performance Index — measure schedule efficiency.
Open Earned ValueCPI Calculator
Cost Performance Index — measure cost efficiency.
Open ForecastingEAC Forecast Calculator
Estimate at Completion — forecast final project cost.
Open ForecastingVAC Calculator
Variance at Completion forecast.
Open ForecastingTCPI Calculator
To-Complete Performance Index — required efficiency to finish on budget.
Open ScheduleEarned Schedule Calculator
Time-based schedule performance (SPI(t)).
OpenOther knowledge pillars

Construction Claims Management Framework Explained
A practical claims management framework for construction and infrastructure projects covering entitlement, records, analysis, negotiation and governance.

PMO Reporting Framework
A reference guide to executive PMO reporting covering dashboard structure, KPI choice, portfolio views, reporting cadence and common reporting mistakes.

Guides and Long-Form Articles
Practitioner-written explainers across EVM, planning, forecasting, risk and PMO design — read as a syllabus or as a refresher.