Interactive Calculators: Putting Project Controls Formulas into Your Hands


Why calculators belong in a learning platform
Reading about EVM is one thing; running EAC on your own project numbers is another. Hands-on calculation is what converts formulas from intellectual knowledge into operational instincts. That is why interactive calculators are not an extra feature on the Academy; they are one of the four core pillars.
Each calculator on PMMilestone runs entirely in your browser. There is no login, no upload and no server-side processing of your numbers. The intent is that you can drop in real project values without any concerns about data leaving your device.
What the catalogue covers
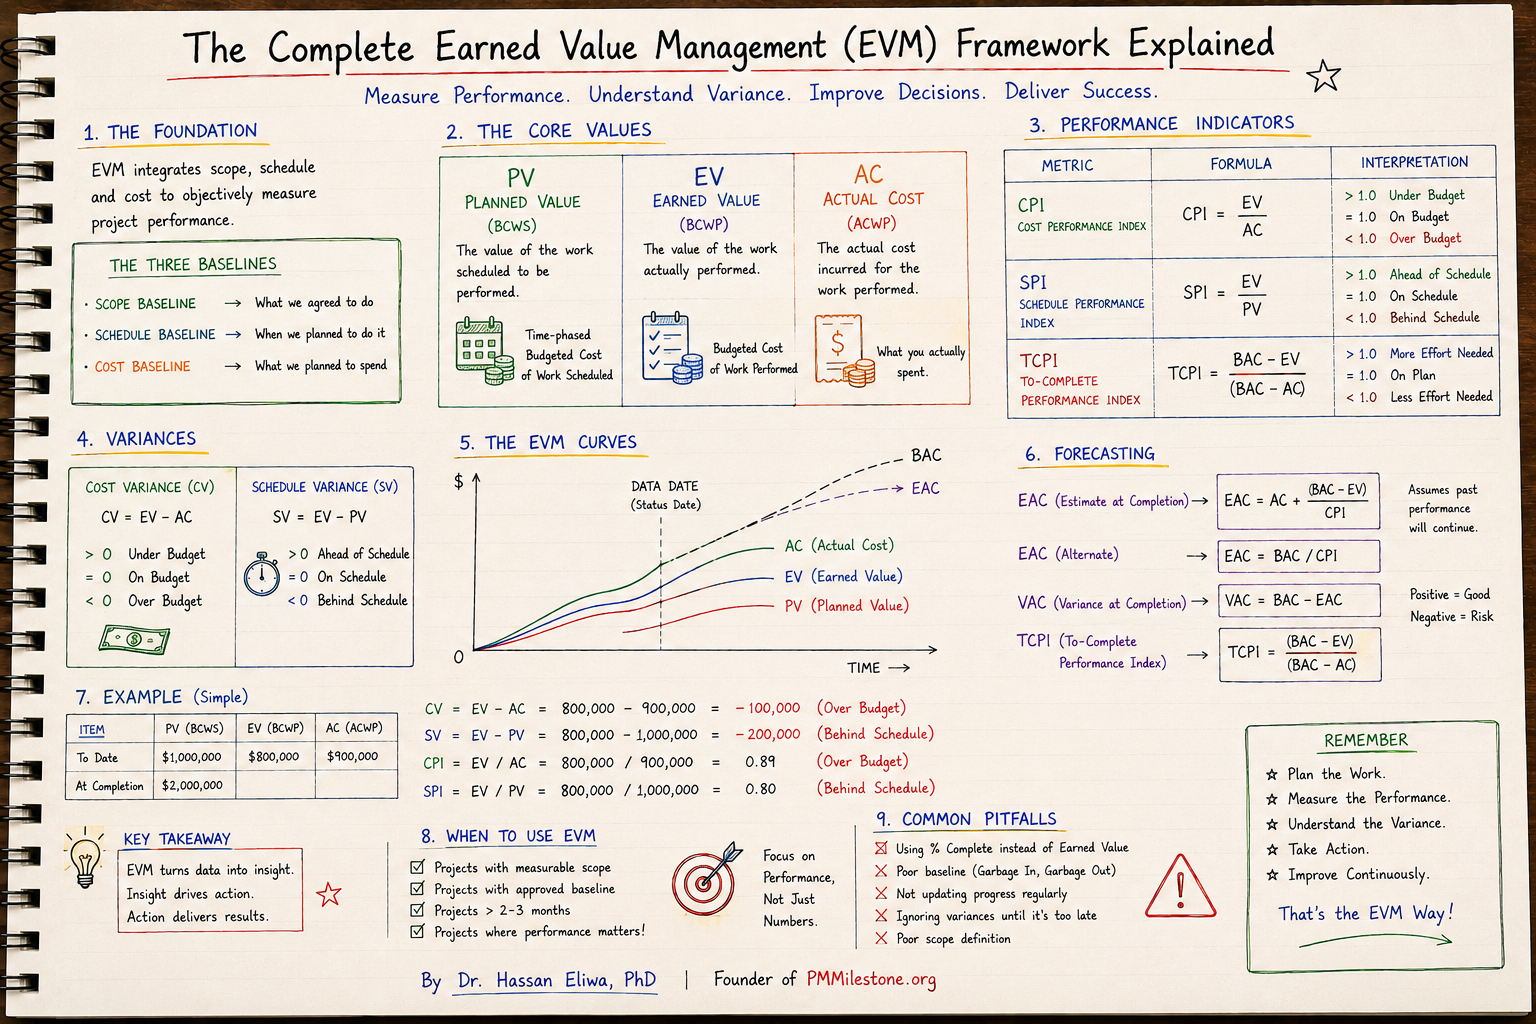
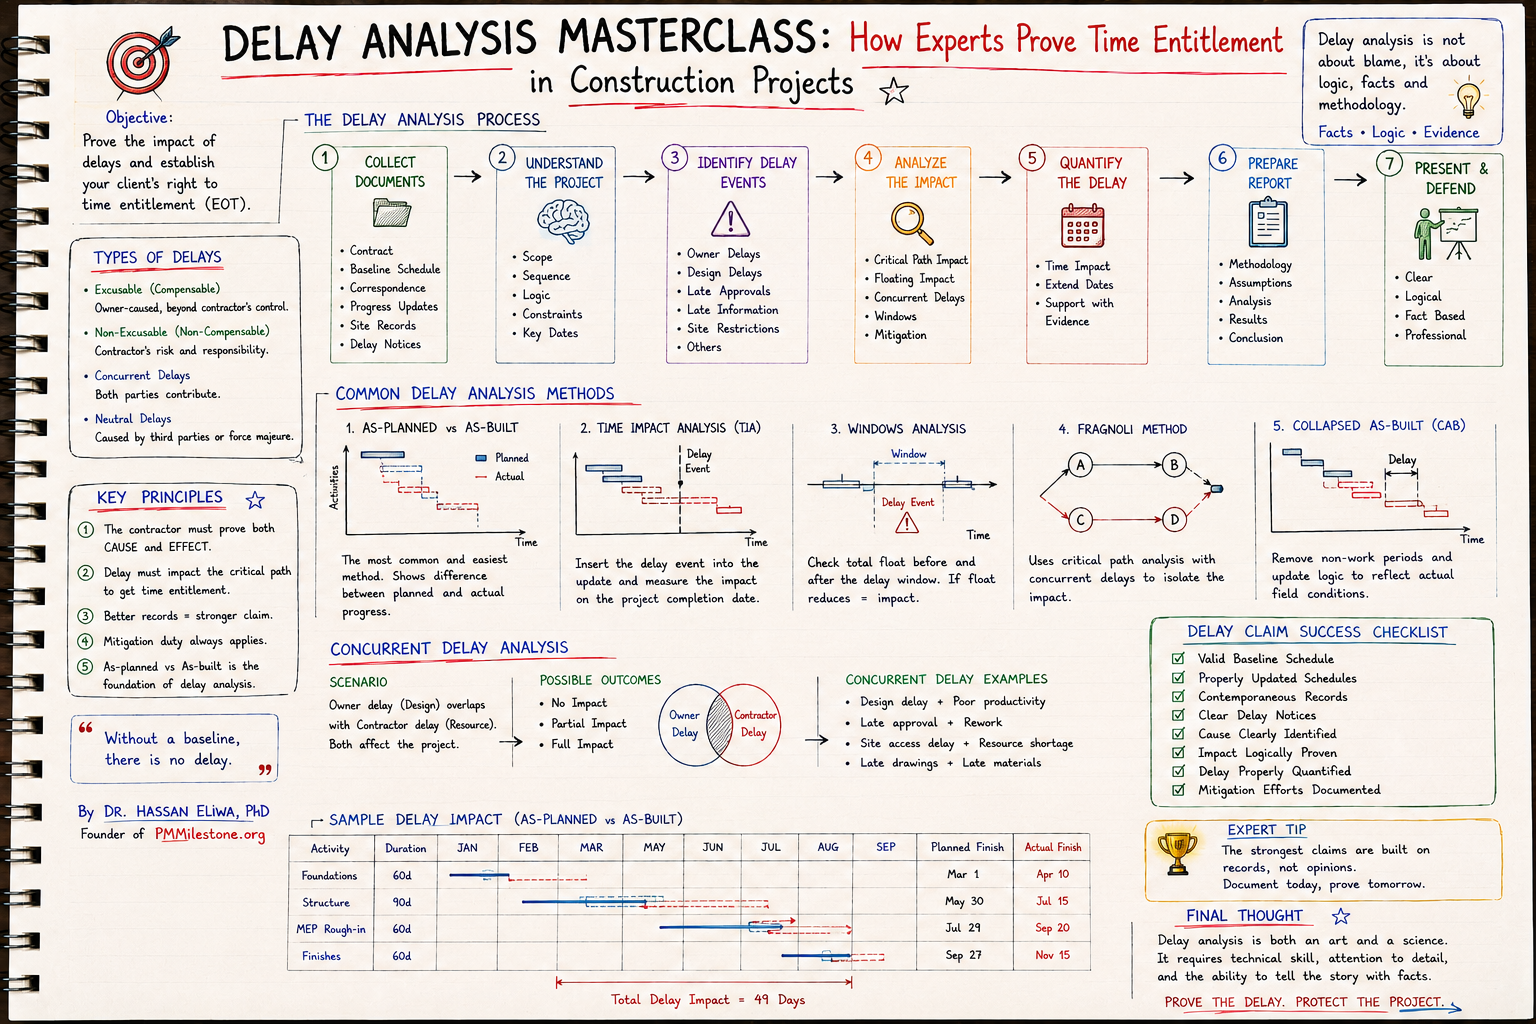
The catalogue spans more than thirty tools across earned value management, schedule and float, risk and contingency, construction productivity, PMO maturity, complexity scoring and career planning. The EVM tools include SPI, CPI, schedule variance, cost variance, EAC variants, ETC, VAC and TCPI. Schedule tools cover float, look-ahead, recovery and delay impact. Risk tools cover Monte Carlo-style contingency sizing and risk priority scoring.
Construction tools focus on labour productivity, variation impact and subcontractor scoring. PMO and career tools support practitioners stepping into senior roles. Every tool is intended to be useful by itself, but the deeper value emerges from combining them on a single real project.
Design principles
The calculators are deliberately small. Each tool does one thing, presents the inputs in plain language, and explains the result with both the raw number and a short interpretation. The aim is for a working professional to land on a calculator, run it in under a minute, and leave with a number they can take into a meeting.
Where a calculator could be ambiguous — for example, the multiple EAC variants — the default is to show the most commonly used formula and to surface the others as options with a brief description of when each applies. The goal is always usefulness over completeness.

How to use them while reading the guides
The most efficient way to use the calculators is in parallel with the Academy guides. When the EVM guide introduces SPI, open the SPI calculator in another tab and run a value from your own project. When the planning guide introduces float erosion, open the float calculator and walk through a recent update.
This is how formulas become muscle memory: not by repetition of the symbols but by repetition of the act of computing on real data. After a few cycles, you will reach for the calculators less because the numbers will already be in your head.
How to use them in real meetings
The other use case is live: sitting in a project meeting, hearing a claim, and wanting to sanity-check it within seconds. The calculators are small enough to load instantly on a laptop or tablet, with inputs that match how the numbers are actually quoted in meetings.
Many practitioners keep a small handful of the most-used calculators bookmarked precisely for this purpose. The act of computing on the spot changes the tone of a meeting more than any prepared slide.
Privacy and trust
Because every calculator runs client-side, your numbers never leave your browser. There is no server log of what you computed, no analytics on individual inputs, and no requirement to identify yourself. This is a deliberate design choice: project controls data is sensitive, and a tool that requires you to upload it is a tool you cannot safely use on real work.
This privacy posture is one of the reasons the calculators have become the most-used pillar of the Academy. Practitioners can use them on the most commercially sensitive projects without compromising their employer's data.
How calculators connect to the other pillars
Each calculator links back to the relevant article in the guides pillar for the underlying theory, to relevant questions in the Q and A pillar for pattern recognition, and to relevant case studies in the insights pillar for real-world examples. The four pillars are designed as a single integrated learning surface rather than as four disconnected libraries.
Used together over time, they convert a library of free tools into a long-term professional development environment.
A calculator is a conversation starter, not the decision
The most professional use of a calculator is not to quote the output as if it ends the discussion. It is to use the output to ask a better question. A CPI of 0.82 should trigger a conversation about productivity, procurement, scope growth or estimating assumptions. An EAC overrun should trigger a discussion about recovery options, not just an updated forecast column.
That is why each PMMilestone calculator is paired with interpretation guidance. The formula gives the number; the interpretation explains what kind of managerial response the number may require. Used this way, calculators become lightweight decision-support tools that strengthen professional judgement rather than replacing it.
A useful habit is to record the assumption behind every calculation you intend to share. If the EAC assumes current CPI continues, say so. If the contingency value assumes a particular confidence level, say so. If the float result depends on the current logic network, say so. Decision-makers trust numbers more when they can see the assumptions that hold them up.
Next steps on PMMilestone
Use these pages to deepen the topic, verify terminology, compare real cases and move from theory into applied project controls practice.
Related calculators
Open the calculators referenced in this article and run them against your own project numbers.
SPI Calculator
Schedule Performance Index — measure schedule efficiency.
Open Earned ValueCPI Calculator
Cost Performance Index — measure cost efficiency.
Open ForecastingEAC Forecast Calculator
Estimate at Completion — forecast final project cost.
Open RiskContingency Reserve Calculator
Calculate a risk-weighted contingency reserve.
OpenOther knowledge pillars
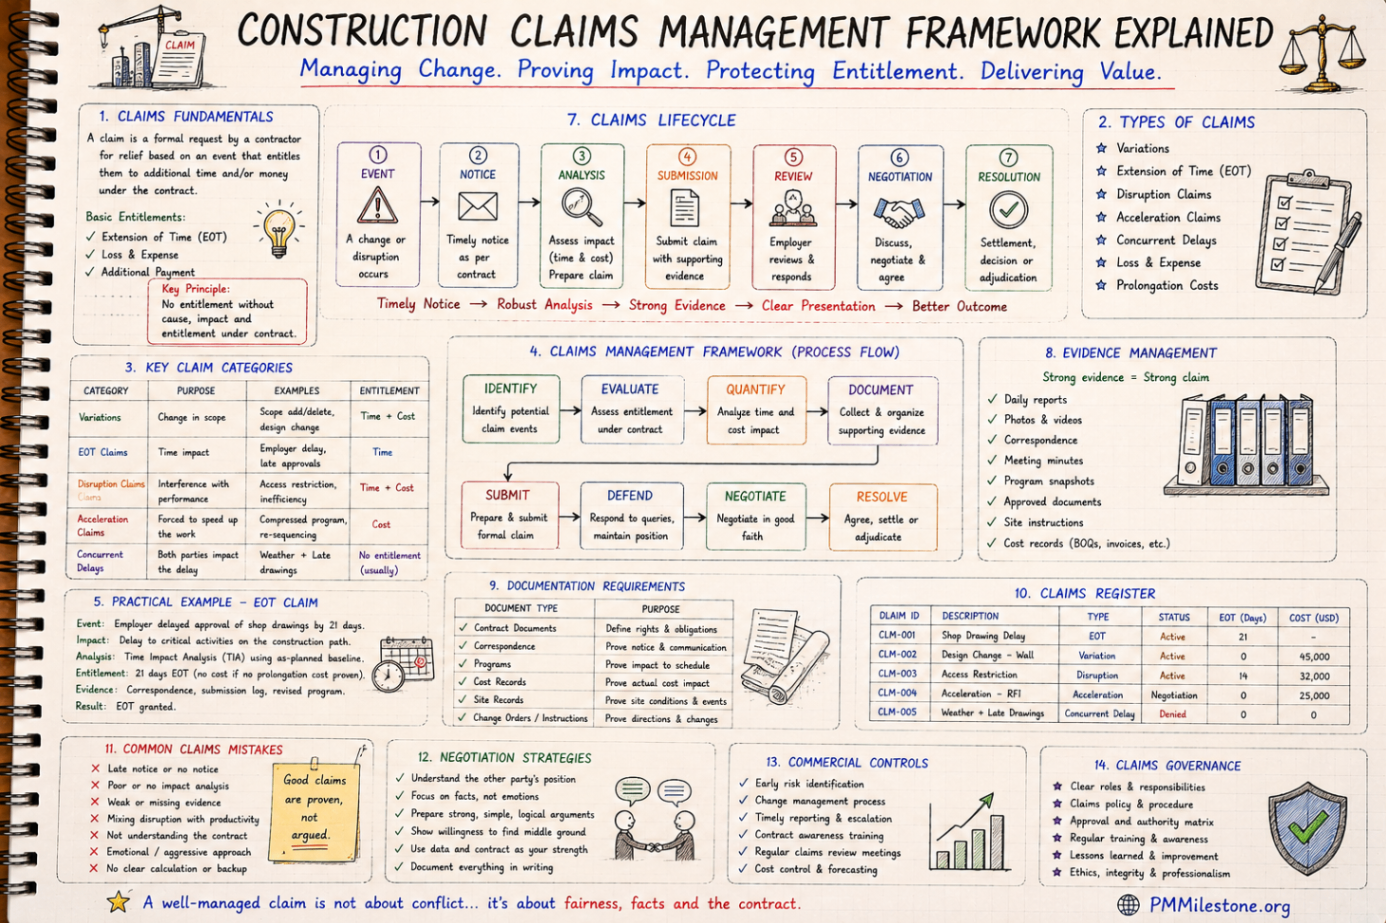
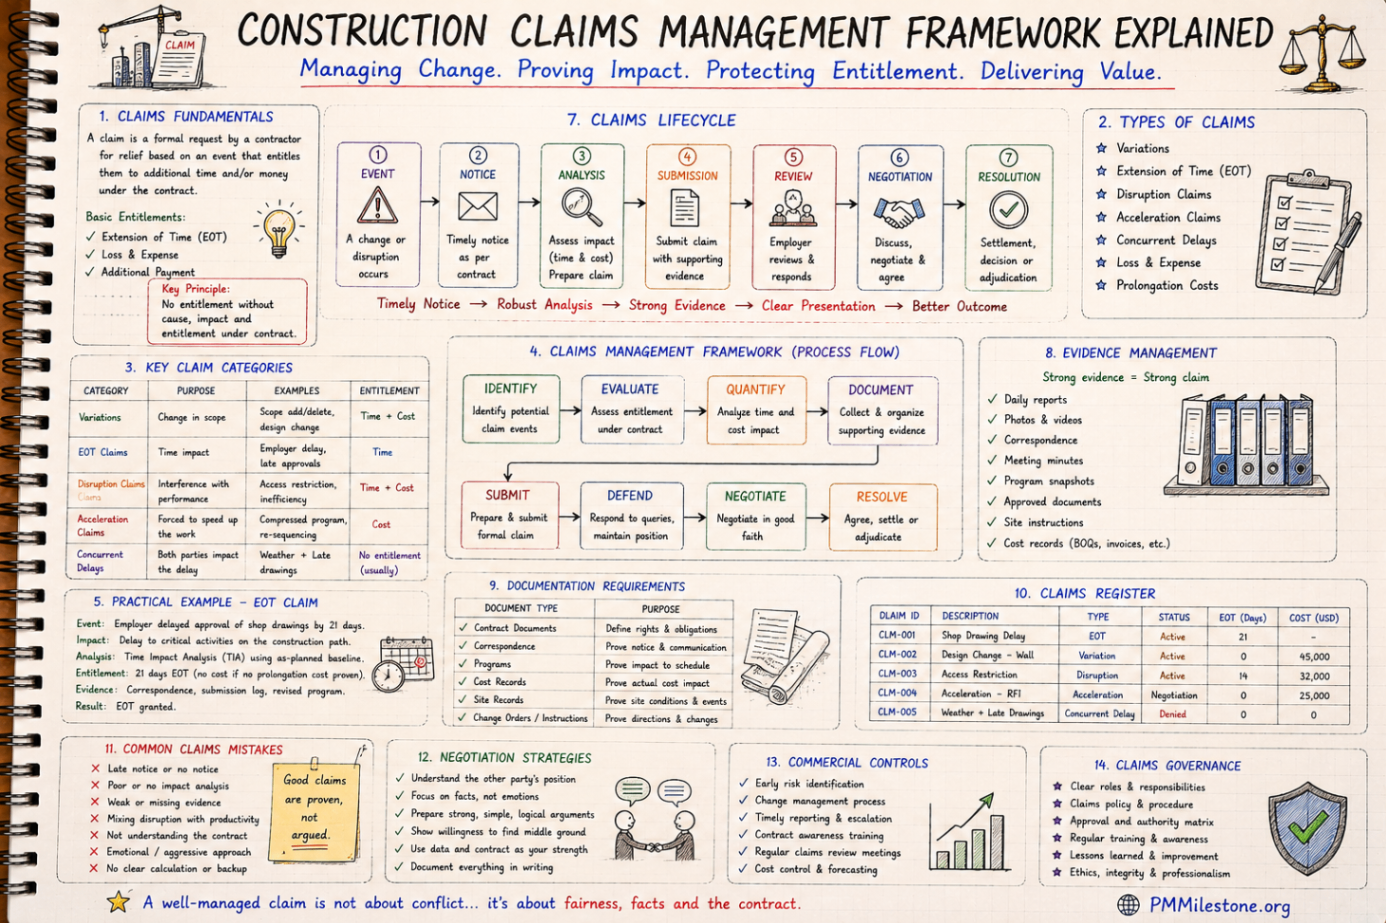
Construction Claims Management Framework Explained
A practical claims management framework for construction and infrastructure projects covering entitlement, records, analysis, negotiation and governance.
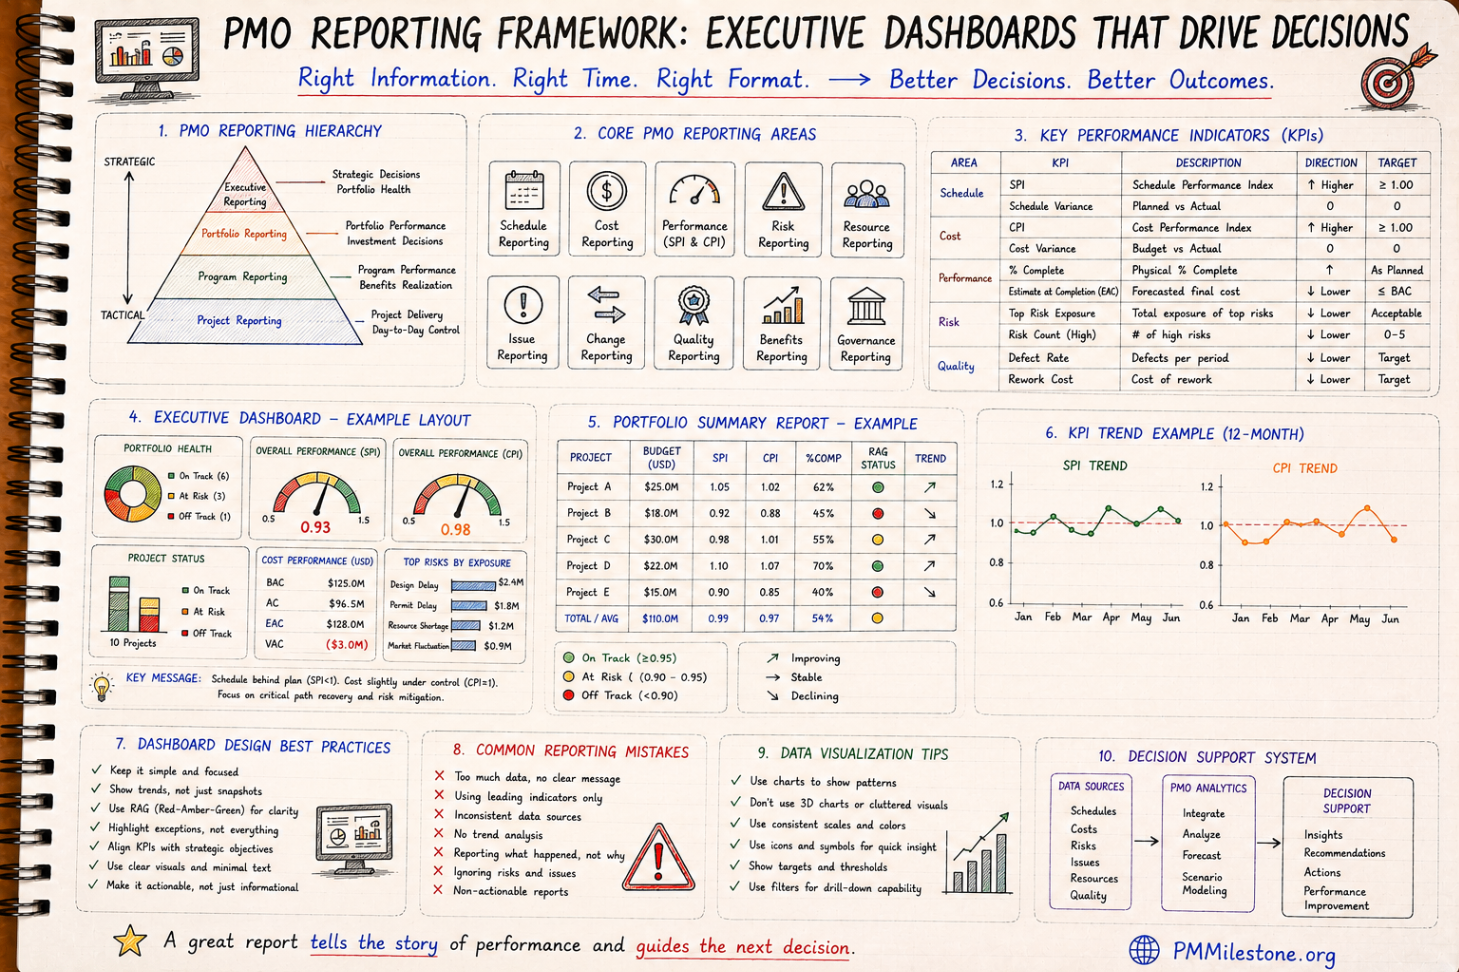
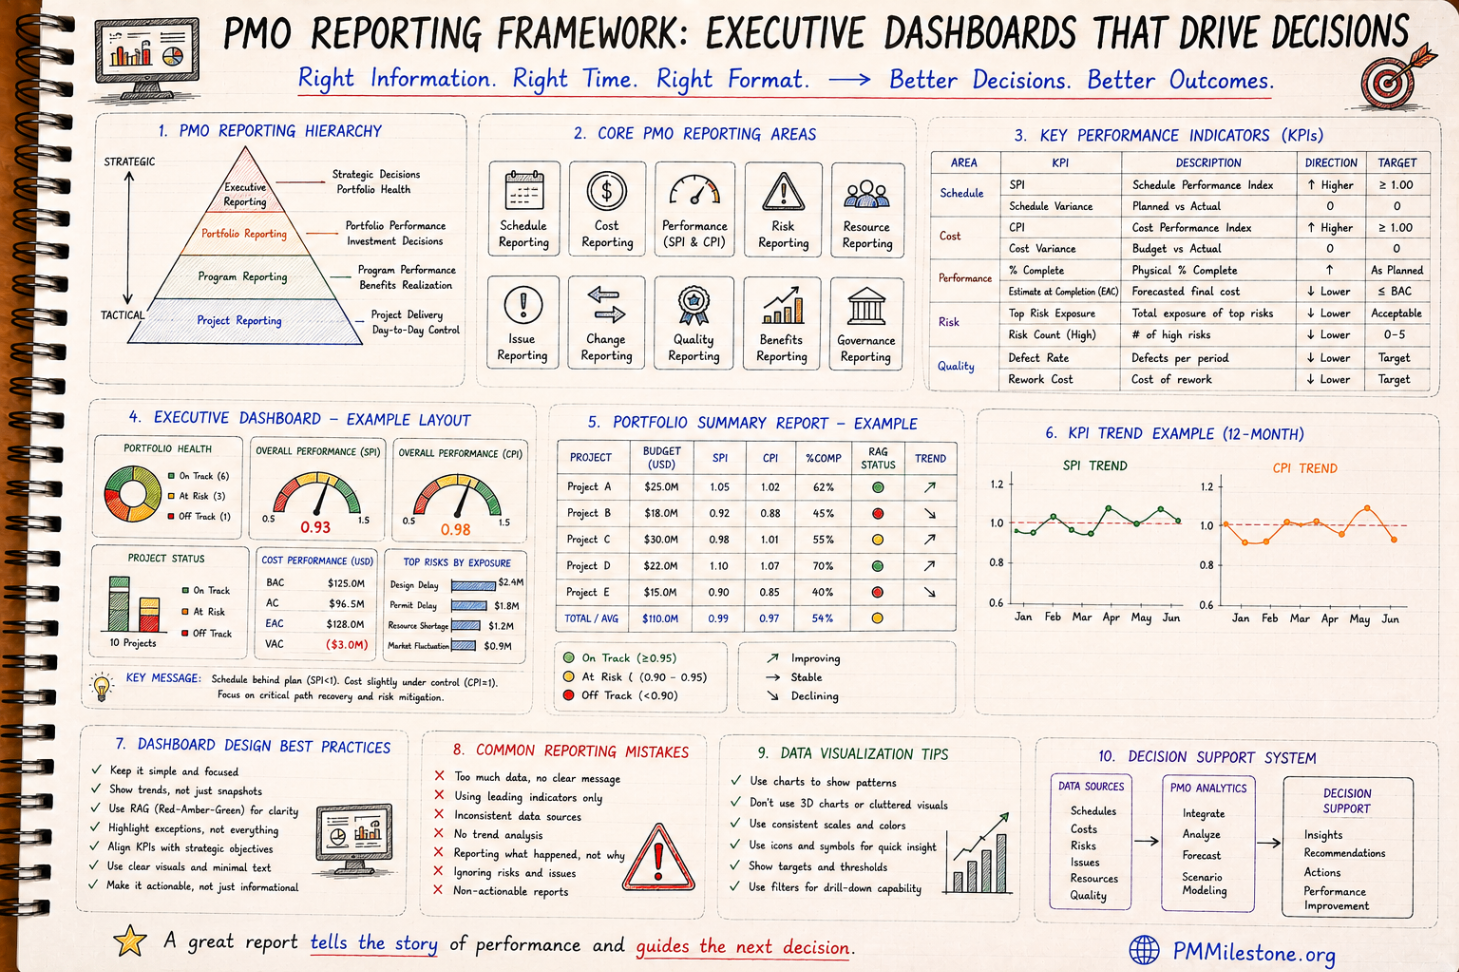
PMO Reporting Framework
A reference guide to executive PMO reporting covering dashboard structure, KPI choice, portfolio views, reporting cadence and common reporting mistakes.

Guides and Long-Form Articles
Practitioner-written explainers across EVM, planning, forecasting, risk and PMO design — read as a syllabus or as a refresher.