The Complete Primavera P6 Learning Path: From First Schedule to Schedule Risk Analysis

Why most P6 training is wrong
Most introductory P6 courses spend the first three days teaching you how to log in, set preferences, configure columns and customise toolbars. By the time you reach the activities tab you have forgotten why you opened the tool in the first place. The reason is that P6 has been taught as a software product rather than as a scheduling model. The result is planners who can navigate the interface but cannot explain what a longest-path calculation is doing under the hood.
This learning path takes the opposite approach. It teaches P6 in the order that a real planner needs it: understand the data hierarchy, model a small project end-to-end, then layer in the advanced features. You will produce a working baseline by the end of part two, run schedule updates by part four and complete an integrated EVM-and-risk analysis by part seven. Treat each part as roughly a week of focused practice on a real or sample project.
Part 1: Data structure — EPS, OBS, WBS and resources
The first thing to internalise about P6 is that it is a relational database with a Gantt chart bolted on top. The Enterprise Project Structure (EPS) is the hierarchy of projects in the database. The Organisational Breakdown Structure (OBS) controls who can see what. The Work Breakdown Structure (WBS) is per-project and is the spine of every schedule you build. Resources are global and shared across projects.
Get this hierarchy right and the rest of P6 is straightforward. Get it wrong — by treating WBS like a list of activities, or by inventing resources project by project — and you will spend the rest of the engagement fighting the tool. Spend a full day on a sample database building an EPS, OBS, WBS and resource pool that matches a real client structure before you write a single activity.
Part 2: Activities, relationships, calendars and your first baseline
Activities in P6 come in seven types: task dependent, resource dependent, level of effort, start milestone, finish milestone, WBS summary and hammock. Ninety percent of activities should be task dependent. Level of effort is used sparingly for things like project management overheads. Milestones are used for handover points, contractual dates and the boundaries between phases. Hammocks are useful for grouping activities that share a start and finish but have no logic of their own.
Relationships are where most schedules go wrong. P6 supports four — finish-to-start (FS), start-to-start (SS), finish-to-finish (FF) and start-to-finish (SF). FS should be the overwhelming majority. SS and FF are useful for overlapping continuous work (concrete pour followed by curing, for example), but every SS and FF should be challenged on review because they hide logic gaps. SF is almost always an error.
Calendars control when work can happen. Global calendars apply across projects; project calendars are local; resource calendars override both for specific resources. The most common P6 mistake is leaving everything on the default 8-hour, 5-day global calendar when the actual site runs 10-hour, 6-day rosters. Set calendars before you load durations.
Once you have activities, relationships and calendars, run the scheduler (F9), review the critical path, fix any open ends and circular logic, save a baseline and you have your first schedule.
Part 3: Resource and cost loading
Resource loading is where P6 stops being a Gantt drawing tool and starts being a project model. Each activity is loaded with the resources it needs — labour, equipment, materials — together with units and rates. P6 then calculates resource demand profiles, levelled durations and time-phased cost.
The most important decision at this stage is the level of granularity. Loading every individual welder on every spool is technically possible but produces a schedule no one can update. The practical rule is to load resources at the crew or trade level, not the individual level, and to use resource codes to roll up to disciplines and contractors for reporting. Pair this with a clean cost-account structure so that cost rolls up the WBS the same way the schedule does — this is the foundation of credible earned value.
Part 4: Baselines, updates and progress measurement
A baseline is a snapshot of the schedule that you measure against for the rest of the project. P6 supports multiple baselines per project — typically a project baseline (the contractual one) and a primary user baseline (the current working forecast). Set both before the project starts.
Updates follow a disciplined weekly or biweekly rhythm: status the schedule as of the data date, enter actual start, actual finish, remaining duration and percent complete, run the scheduler, review variances, save the update. The most common mistake is statusing inconsistently — some activities by remaining duration, others by percent complete, others by physical measurement. Pick one progress method per activity type and stick with it. The Earned Value Management track explains the trade-offs in depth.
Part 5: Codes, filters, groupings and layouts
Activity codes are P6's superpower. They let you tag every activity with attributes — contractor, area, system, discipline, phase, contract package — and then filter, group and report by any combination. A well-coded schedule of 12,000 activities can be sliced into a 200-activity executive view in seconds. A poorly coded schedule of the same size requires manual extraction every week.
Set up your code structure before you load activities. Common codes worth investing in: Phase (engineering, procurement, construction, commissioning), Discipline (civil, mechanical, electrical, instrumentation), Area or System (depends on project), Contractor, Reporting Level (1 to 5). Then build layouts — saved views with specific columns, groupings, filters and bar styles — for each audience: planner working view, project manager review, client report, executive summary.
Part 6: Claim Digger and schedule quality checks
Claim Digger (formally Schedule Comparison) is the tool that compares two schedules — typically baseline and current — and lists every change in activities, durations, relationships, constraints and codes. It is essential for change control on any project where the contractor is required to justify schedule slips.
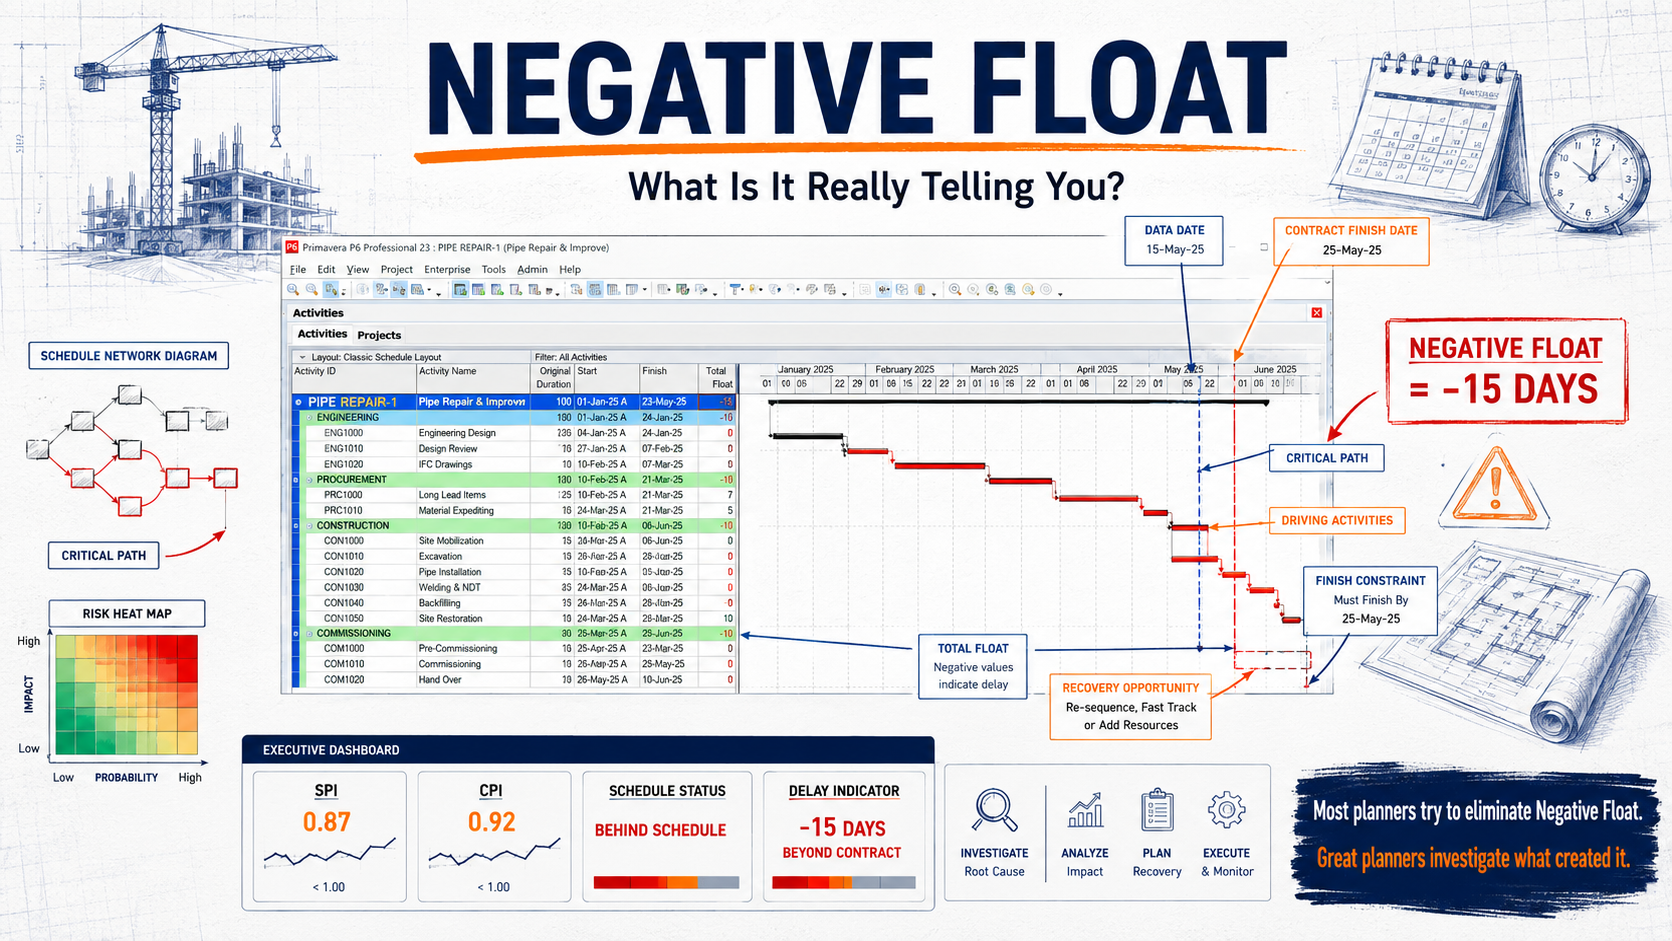
Quality checks against the DCMA 14-point assessment (logic, leads, lags, relationship types, hard constraints, high float, negative float, high duration, invalid dates, resources, missed tasks, critical path test, critical path length index, baseline execution index) are the planner's equivalent of a code review. Run them on every monthly submission. A schedule that fails more than three of the fourteen checks is usually unfit for purpose, regardless of how elegant the Gantt looks.
Part 7: Schedule risk analysis
The final layer is schedule risk analysis (SRA). Tools like Primavera Risk Analysis, Acumen Risk and Safran wrap around P6 and apply probability distributions to durations and risk events. A Monte Carlo simulation runs the schedule thousands of times and produces a probabilistic completion date — typically expressed as P50 (50% confidence), P80 and P90.
SRA is what turns a single-point deterministic schedule into a defensible forecast. It is also what feeds contingency reserve sizing on the cost side. The Risk and Reserves track explains the analytics; for the planner, the practical skill is knowing which distributions to use (triangular for most durations, lognormal for tail-heavy ones), how to model risk events as conditional branches, and how to communicate the results to a non-technical sponsor without losing the nuance.
What good looks like by the end of the path
A planner who has worked through this path can build a credible baseline schedule from scratch, load resources and cost, run weekly updates with consistent progress measurement, pass DCMA quality checks, produce layouts for four different audiences, run a schedule risk analysis and write a one-page narrative that explains the forecast to a board. That is the working definition of a senior planner in any sector.
Beyond this path, the next investments are integration — P6 to ERP for cost actuals, P6 to BI tools for executive reporting, P6 to risk analysis tools — and leadership skills covered in the Project Controls Career Roadmap article. The tool is the easy part; what compounds is judgement about how to use it.
Frequently asked questions
How long does it take to become competent in P6?
About six months of regular use to be productive and 18–24 months on real projects to be genuinely senior with it.
Is Microsoft Project a substitute for P6?
For small projects yes; for resource-loaded, multi-contractor capital projects, no — P6's database architecture and codes structure scale in ways Project does not.
Do I need a separate tool for schedule risk analysis?
Yes — Primavera Risk Analysis, Acumen Risk and Safran are the most common; P6 itself has no Monte Carlo capability.
How important is DCMA 14-point compliance?
Very, especially on government and energy projects. Failing more than three checks typically blocks acceptance of a monthly submission.
Next steps on PMMilestone
Use these pages to deepen the topic, verify terminology, compare real cases and move from theory into applied project controls practice.
Related calculators
Open the calculators referenced in this article and run them against your own project numbers.
SPI Calculator
Schedule Performance Index — measure schedule efficiency.
Open ScheduleEarned Schedule Calculator
Time-based schedule performance (SPI(t)).
Open ScheduleFloat Erosion Analyzer
Track total float consumed on critical paths.
Open ScheduleCritical Path Risk Score
Score the fragility of your critical path.
Open ScheduleSchedule Compression Calculator
Cost per day of crashing the schedule.
Open ScheduleDelay Impact Calculator
Estimate the financial impact of project delays.
OpenOther learning tracks

Construction Claims Career Path
A practical roadmap for engineers moving from site delivery into planning, delay analysis, claims, commercial controls and senior claims consulting.

Project Controls Digital Transformation Roadmap
A future-focused guide to modern project controls through data integration, reporting automation, Power BI, AI, BIM and digital PMO capability building.
Project Controls Fundamentals
Scope, schedule, cost, risk, quality and reporting — the six disciplines that hold every successful capital project together, taught from first principles.