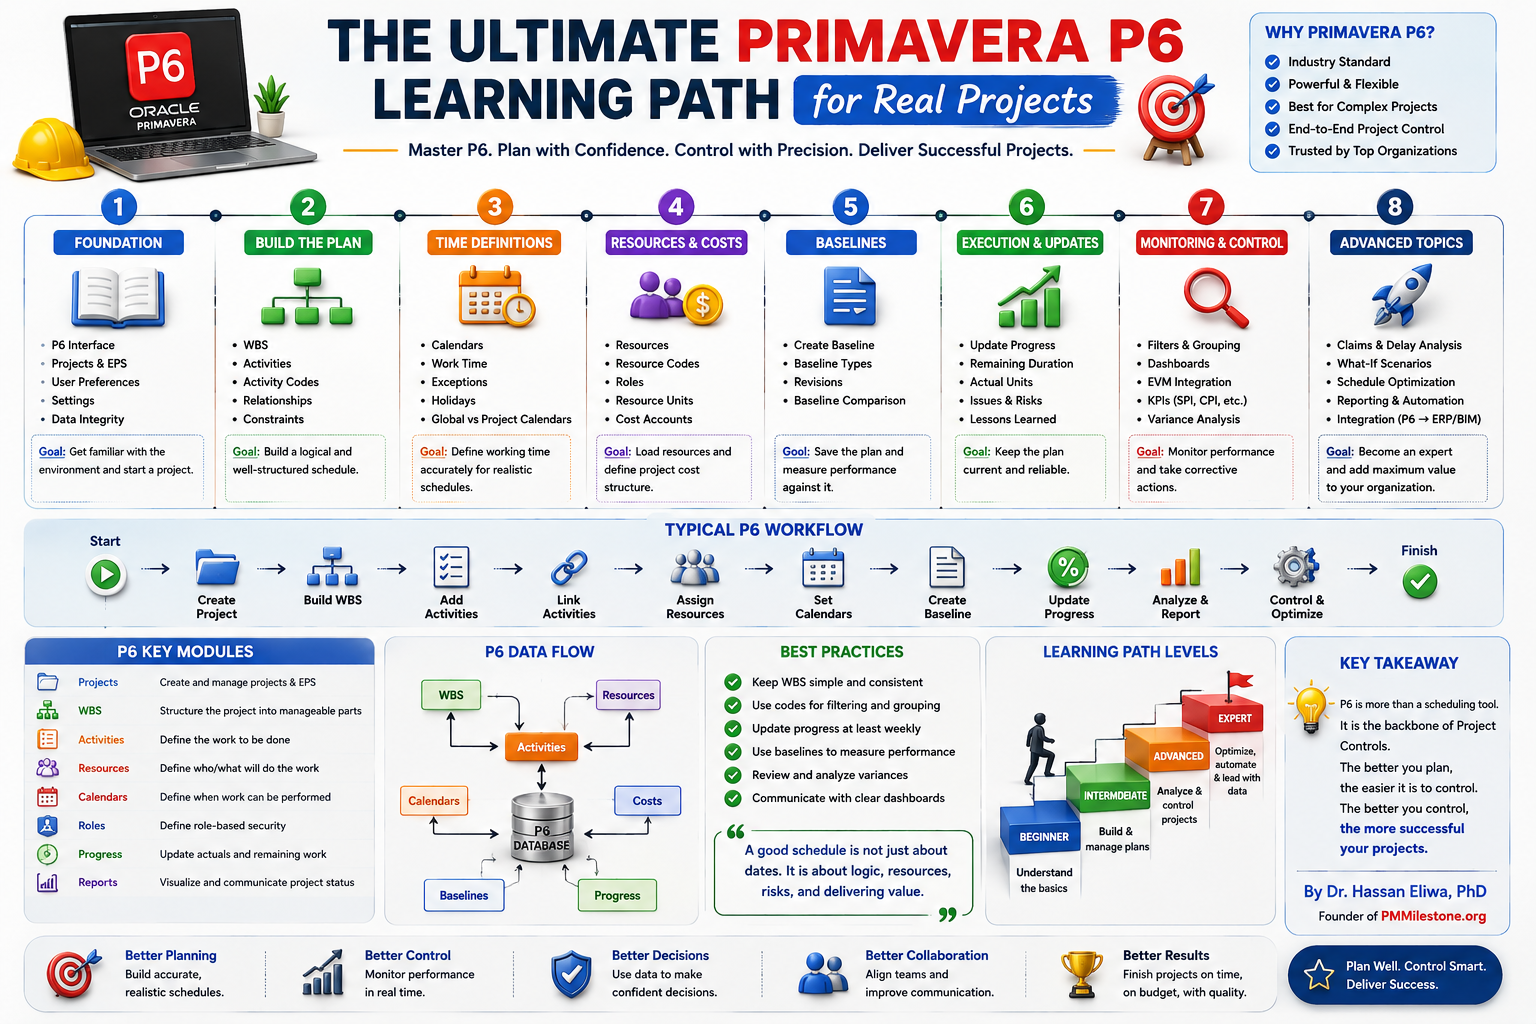
The Ultimate Primavera P6 Learning Path for Real Projects

Why a structured Primavera P6 learning path matters
I have trained planners and project controls engineers on Primavera P6 across construction, oil & gas, transport infrastructure and large building projects for more than a decade. The single most common pattern I see is the same: an engineer with two or three years of P6 exposure who can update activities and produce a Gantt chart, but cannot explain why their critical path is what it is, why the baseline is misaligned, or why their EVM numbers do not match the cost report. The cause is almost never lack of intelligence — it is fragmented learning. P6 is not a single tool; it is a database with about a dozen interconnected modules, and skipping any of them creates blind spots that take years to discover.
This learning path is the eight-stage sequence I wish every planner could follow before they touch a live project. It is built around how P6 actually works as a system — projects and EPS, then WBS, activities and logic, then calendars and time definitions, then resources and costs, then baselines, then updates, then monitoring, then advanced topics — and it is anchored in the real workflows you will use on site. Treat it as a curriculum, not a reference manual.
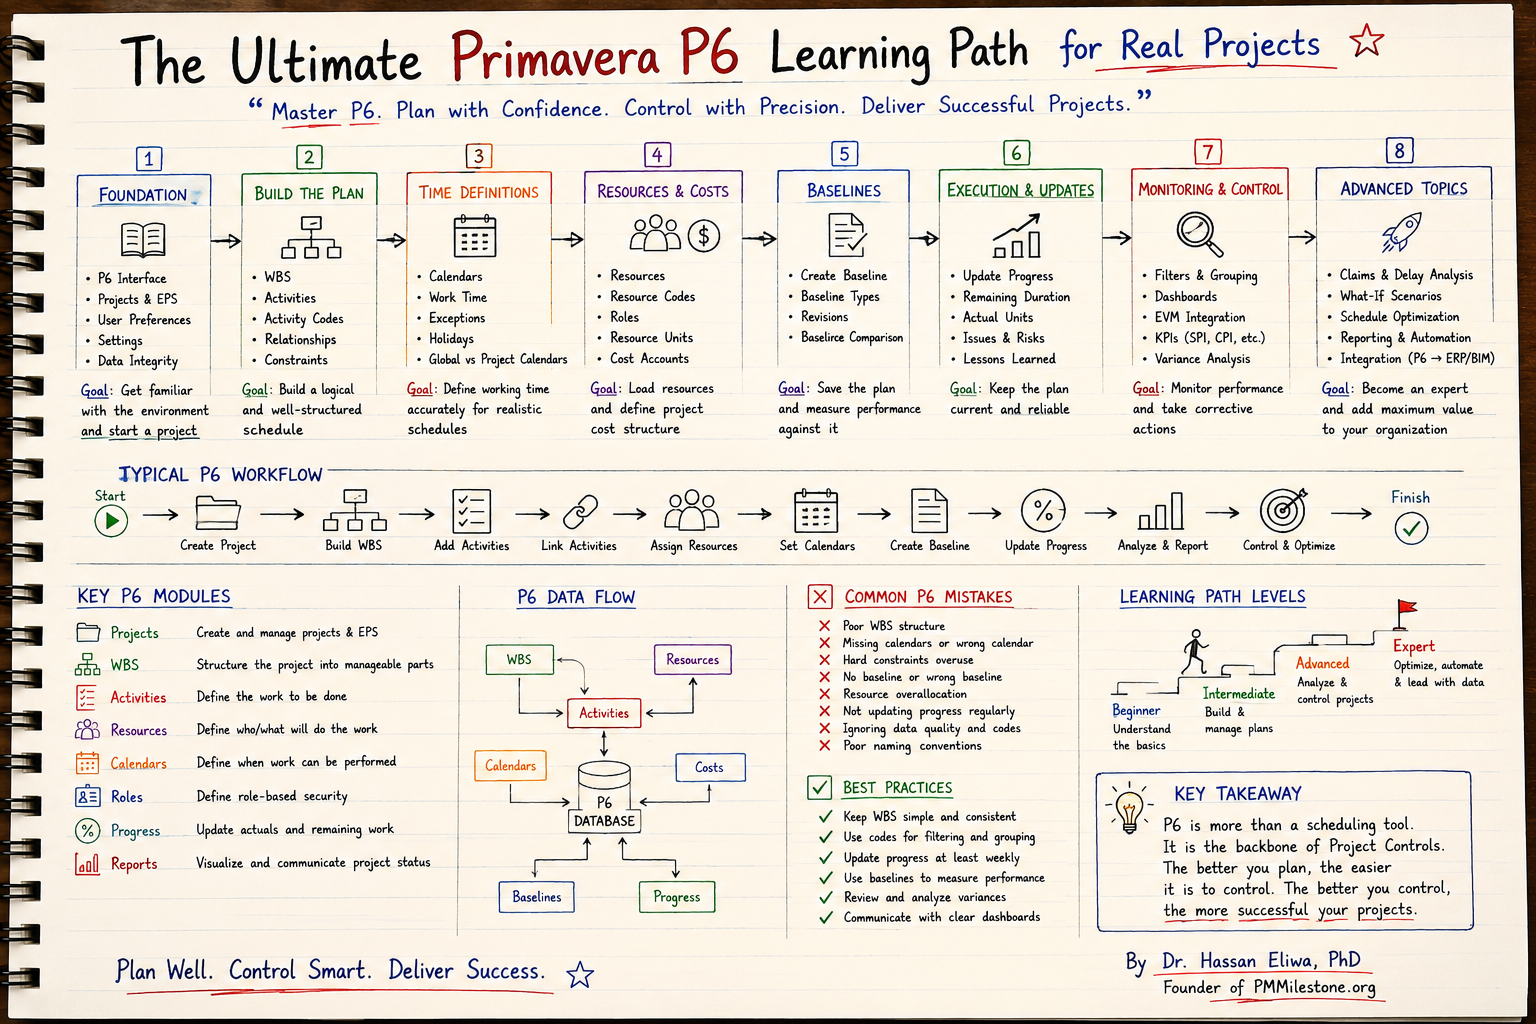
Stage 1 — Foundation: the P6 interface, EPS, projects, settings and data integrity
Stage 1 is the stage almost everyone rushes. Do not. Spend a full week understanding the P6 interface, the difference between Projects and the EPS hierarchy, user preferences (units, dates, time periods, calculations), admin preferences (data limits, currencies) and the basics of data integrity. The vast majority of broken P6 schedules I have inherited started life because the planner clicked through the user preferences screen without reading it. A wrong time period setting can quietly multiply or divide every duration in your project.
The deliverable at the end of Stage 1 is small but important — create your own training project under a sensible EPS node, set the calendar to the project's working pattern, set the user preferences to match the company standard, and document a one-page data-integrity checklist. The goal, in the words of the roadmap above, is simply to get familiar with the environment and start a project.
Stage 2 — Build the plan: WBS, activities, activity codes, relationships and constraints
Stage 2 is where the schedule actually becomes a schedule. Build the WBS first, top down, in plain English that the project manager can recognise — never let it become a copy of the cost code structure. Then add activities under each WBS node with consistent naming, set durations, and link them with relationships (FS, SS, FF, SF) that reflect the real construction sequence. Activity codes are not optional: they are how you will filter and group the schedule six months later when it has grown to three thousand lines.
Two warnings from the field. First, treat hard constraints (Mandatory Start, Mandatory Finish) like a controlled substance — almost every overuse of constraints I have audited has hidden a logic problem rather than solved one. Second, avoid open ends; every activity except project start and finish should have at least one predecessor and one successor. Refresh the underlying concepts in the Planning and Scheduling track if any of this is rusty.
Stage 3 — Time definitions: calendars, work time, exceptions and holidays
Stage 3 is the most underestimated stage in the entire learning path. Calendars define when work can happen, and they drive every date P6 calculates. Get them wrong and the entire schedule lies. On a typical construction project you will have a global default calendar, several discipline-specific calendars (concrete cure, commissioning, regulatory shutdown windows), and possibly resource-specific calendars for crews working unusual shifts.
Spend real time on the difference between global and project calendars, on exceptions for holidays and seasonal shutdowns, and on how non-working time interacts with constraints. A common failure mode on infrastructure projects is forgetting to add the wet-season exception window to the calendar — the resulting schedule then shows critical works happening in conditions the contract explicitly excludes.
Stage 4 — Resources & costs: resources, resource codes, roles, units and cost accounts
Stage 4 takes the schedule from a time model to a time-plus-resource-plus-cost model. Define resources (labour, equipment, materials), assign roles where you have not yet hired the named person, set up resource codes for grouping and reporting, define units of measure carefully, and connect the resources to the cost account structure that the cost team uses. This is the bridge between the schedule world and the cost world — done well, it is the foundation of every EVM calculation downstream.
The single most useful sanity check at this stage is to summarise resource hours by week and compare them against site labour histograms. If your peak crew count is double the size of the actual workforce, the schedule is not deliverable and the baseline you are about to lock in is fiction. Pair this stage with the Earned Value Management track to see how the resource and cost data flow into PV, EV and AC.
Stage 5 — Baselines: creation, types, revisions and comparison
A baseline is the contractual photograph of the plan. Stage 5 covers how to create one in P6 (Project → Maintain Baselines), the difference between project baseline and user baseline, when to take a revision (re-baseline) versus when to keep the original baseline and explain the variance, and how to use baseline comparison views to see drift over time.
Two field rules. First, never delete a baseline — archive it. You will need it during a claims discussion two years later when nobody remembers what was agreed. Second, agree the re-baseline rules with the client before the project starts: which events justify a new baseline, which require contract change orders, and how the old baseline is referenced afterwards. This single conversation saves enormous pain.
Stage 6 — Execution & updates: progress, remaining duration, actuals, issues, risks and lessons learned
Stage 6 is where most planners spend the rest of their career. The discipline that separates good planners from average ones is the weekly update rhythm: collect physical percent complete from site, enter actual start and finish dates, update remaining duration based on what the site team actually believes (not what the original plan said), reconcile against the schedule of values, and run the schedule with a clean data date.
Pair every update with two short artefacts: a variance commentary (three bullets, no adjectives) and an issues & risks note (what changed since last week, what we are watching). Over a project lifecycle these short notes become the audit trail that supports every claim, every recovery plan and every lessons-learned register.
Stage 7 — Monitoring & control: filters, grouping, dashboards, EVM integration, KPIs and variance analysis
Stage 7 elevates P6 from a planning tool to a controls system. Build a small set of standard layouts and saved filters that you use every week — critical path, near-critical path (float ≤ 10d), late activities, activities by responsible party, look-ahead by discipline. Connect P6 to a reporting layer (Power BI or a custom dashboard) so that SPI, CPI, EAC and variance trends are visible without anyone having to open P6.
EVM integration is the single highest-leverage skill at this stage. Once your P6 resource loading is reliable and your cost actuals are clean, the SPI/CPI calculation becomes meaningful and you can start forecasting EAC with confidence. Practise on real numbers using the SPI, CPI and EAC calculators in the PMMilestone tools library before you publish anything to the project board.
Stage 8 — Advanced topics: claims & delay analysis, what-if scenarios, optimisation, automation and integration
Stage 8 is where the difference between a good planner and a senior project controls engineer is decided. Advanced topics include forensic delay analysis (time impact analysis, windows analysis, as-planned vs as-built), what-if scenario testing using copies of the project, schedule optimisation (resource levelling, crashing, fast-tracking — covered in the Schedule Compression calculator), reporting automation through SDK or BI tools, and integration with ERP and BIM environments.
Most planners never reach Stage 8 because they are stuck firefighting at Stage 6. The way to break the cycle is to block one half-day per fortnight specifically for Stage-8 work and protect it from operational interruption. The compounding effect over a year is enormous.
The typical P6 workflow on a real project
On a typical project the workflow runs: create project → build WBS → add activities → link activities → assign resources → set calendars → create baseline → update progress → analyse and report → control and optimise. The stages of the learning path map directly onto that workflow, which is why teaching P6 in stage order produces planners who can actually run a live project rather than just navigate the screens.
P6 data flow: how the modules connect
Behind the screens, P6 is a relational database. The WBS, activities, calendars, resources and costs all flow into a single P6 database, and baselines and progress data flow out of it. Understanding that data flow is what lets you trust the numbers — and what lets you diagnose why an SPI looks wrong without having to phone Oracle support. Every module you see in the navigator is a view of the same underlying data.
Common Primavera P6 mistakes (and how to avoid them)
Across hundreds of P6 schedules I have audited, the same mistakes appear again and again. Poor WBS structure — usually too deep, with WBS nodes that are really activities. Missing or wrong calendars — global default used for resources who do not work that pattern. Hard constraint overuse — Mandatory Start dates used to hide logic problems. No baseline, or a baseline taken months after work started. Resource overallocation — schedules that quietly demand 60 people on a site that has space for 25. Irregular updates — monthly instead of weekly, with the data date drifting. Ignoring data quality and activity codes — making the schedule unfilterable. And poor naming conventions — making the schedule unreadable to anyone but the original planner.
Each of these is fixable in an afternoon if you spot it early and ruinous if you do not. Audit your own schedule against this list quarterly.
Best practices that compound
Keep the WBS simple and consistent. Use activity codes and resource codes to make filtering trivial. Update progress at least weekly. Use baselines to measure performance, not to be ignored. Review and analyse variances every cycle, even when nothing dramatic has changed. Communicate through clear, audience-appropriate dashboards rather than raw P6 screenshots — executives do not read Gantt charts.
Above all, treat the schedule as a living model of the project, not as a deliverable that exists to satisfy a contract clause. The planners who internalise that view are the ones whose schedules survive contact with reality.
Learning path levels: where are you now?
Beginner planners understand the basics — they can open a project, enter activities and produce a Gantt chart. Intermediate planners can build and manage plans end to end on a discrete scope, including baselines and weekly updates. Advanced planners analyse and control projects — schedule risk analysis, EVM, claims awareness, dashboards. Experts optimise, automate and lead with data — they design the controls system, integrate P6 with the broader enterprise stack, and mentor the rest of the team.
Use the eight-stage path above to identify which level you are at and what specifically separates you from the next one. Then pick the next two skills and put them on a 90-day plan.
Key takeaway
P6 is more than a scheduling tool. It is the backbone of project controls. The better you plan, the easier it is to control. The better you control, the more successful your projects. Pair this learning path with the Planning and Scheduling track, the Earned Value Management track and the Delay Analysis learning track for the complete picture of how P6 fits into the wider controls system, and use the PMMilestone calculators to practise the metrics on real data.
Frequently asked questions
How long does it realistically take to become competent in Primavera P6?
Around 6–12 months of consistent use on a real project to reach a reliable intermediate level, and 3–5 years to reach an advanced level where you can run EVM, schedule risk analysis and delay analysis with confidence.
Is Microsoft Project a viable alternative to P6 on large projects?
MS Project is excellent for small to medium projects. On large EPC, infrastructure, oil & gas and mega construction projects, P6 remains the industry standard because of its resource model, multi-project capabilities and audit trail.
Do I need a P6 certification to get hired?
It helps at junior rungs as a tool-fluency signal. From mid-career onward, demonstrable project experience matters more. Pair P6 fluency with a broader credential like the AACE PSP or PMI-SP.
Should baselines ever be deleted?
No. Archive them under a new project name or use baseline revisions. Deleted baselines destroy the audit trail you will need during claims or lessons-learned reviews.
How often should I update the schedule?
Weekly during execution on most projects. Bi-weekly is acceptable on slow-moving design or commissioning phases. Monthly updates almost always allow problems to accumulate undetected.
Next steps on PMMilestone
Use these pages to deepen the topic, verify terminology, compare real cases and move from theory into applied project controls practice.
Related calculators
Open the calculators referenced in this article and run them against your own project numbers.
SPI Calculator
Schedule Performance Index — measure schedule efficiency.
Open Earned ValueCPI Calculator
Cost Performance Index — measure cost efficiency.
Open ForecastingEAC Forecast Calculator
Estimate at Completion — forecast final project cost.
Open Earned ValueSchedule Variance (SV) Calculator
Measure schedule variance in dollars.
Open ScheduleSchedule Compression Calculator
Cost per day of crashing the schedule.
Open ScheduleCritical Path Risk Score
Score the fragility of your critical path.
Open RiskRAID Log Severity Score
Weighted RAID severity calculator.
OpenOther learning tracks

Construction Claims Career Path
A practical roadmap for engineers moving from site delivery into planning, delay analysis, claims, commercial controls and senior claims consulting.

Project Controls Digital Transformation Roadmap
A future-focused guide to modern project controls through data integration, reporting automation, Power BI, AI, BIM and digital PMO capability building.
Project Controls Fundamentals
Scope, schedule, cost, risk, quality and reporting — the six disciplines that hold every successful capital project together, taught from first principles.