How Expert Planners Read a Primavera P6 Schedule in Just 10 Minutes


The ten-minute test that decides whether to trust a programme
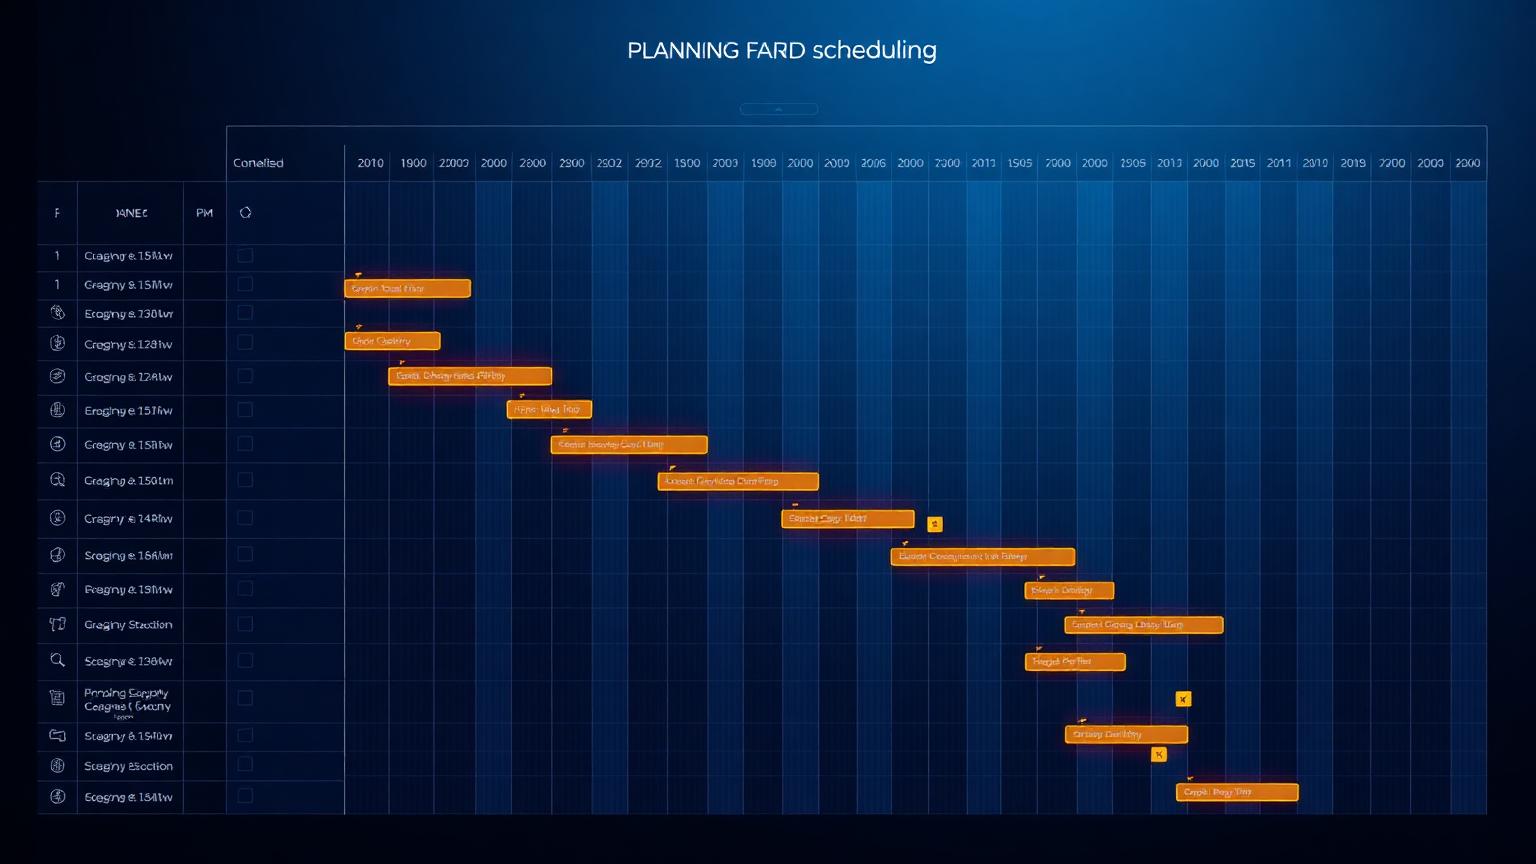
The first time I was handed a Primavera P6 schedule and told "the meeting starts in ten minutes, tell me if we can trust it," I froze. The programme had roughly 4,000 activities across six work breakdown structure levels, a resource loading tab, and three baselines. Ten minutes felt impossible. Fifteen years later, ten minutes is generous. The trick was never speed-reading every line. It was learning the small number of things that actually decide whether a schedule is honest, buildable, and worth arguing about.
This article is the sequence I now teach every junior planner on my team. It is not about becoming a P6 button-clicker. It is about reading a programme the way an experienced surveyor reads a set of drawings — going straight to the load-bearing information and letting the decorative detail wait. If you follow the five two-minute passes below, you will walk into any schedule review able to ask the questions that matter.
The pattern pairs naturally with the Primavera P6 learning path, the Planning & Scheduling knowledge pillar, and the Delay Analysis Masterclass.
| Pass | Time | The one question you answer |
|---|---|---|
| Frame & data date | 0–2 min | What am I looking at, and is it statused honestly? |
| Critical / longest path | 2–4 min | Does the driving path describe how it gets built? |
| Logic & open ends | 4–6 min | Is this a real network or a wish list? |
| Float health | 6–8 min | Where is the programme tight, and where is it dangling? |
| Resource & cost sanity | 8–10 min | Is this physically buildable as staffed? |
Why ten minutes is the right target
A schedule review is rarely the place you build a full forensic analysis. You do that later, alone, with the XER file open and a coffee. The ten-minute read has a different job: to tell you whether the programme in front of you is directionally trustworthy and where its soft spots are. On a live project — a hospital, a motorway, a wastewater plant — the cost of missing an obvious problem is measured in monthly claims and delayed handovers, not in academic elegance.
I learned this on a $52 million regional hospital fit-out where the main contractor's programme looked immaculate in the printout. Clean bars, tidy WBS, a confident finish date. Ten minutes with the actual P6 file told a different story: the critical path ran through a single medical-gas commissioning activity with a hard "Finish On" constraint that was quietly holding the whole thing together. Remove the constraint and the completion date slipped eleven weeks. Nobody in that room had opened the file properly. That is what the ten-minute read protects you from. Similar patterns run through the Project Failure Database and the Mega Project Case Studies.
Pass 1 (0–2 min) — Frame the programme and find the data date
Before you judge anything, you need to know what you are looking at. Open the project and check five things in quick succession: the data date, the total activity count, the number of open baselines, the calendar in use, and the position of the key contractual milestones.
The data date is non-negotiable. It is the line in the sand that separates actual progress from forecast. If someone shows you a "current" programme with a data date from two months ago, you are looking at fiction, and every float figure downstream is wrong. Anything to the left of the data date should be actualised; anything to the right is plan. Definitions live in the Project Controls Glossary.
Sort the activity list by "Actual Start" with the data date visible. If you see activities that have "started" to the right of the data date, or in-progress work sitting to the left with no actuals, the schedule has not been statused honestly. This one sort catches more nonsense than any other single check.
Pass 2 (2–4 min) — Trace the critical and longest path
Now filter to the critical path. In P6, I prefer the Longest Path filter over the default "Total Float ≤ 0," because negative or zero float can be created artificially by constraints, whereas the longest path follows the true driving logic. Read the chain out loud in plain language: "Enabling works drives steel, which drives the level-2 slab, which drives facade, which drives MEP rough-in…" If that sentence describes how the building actually gets built, good. If it jumps from a minor activity straight to handover, the logic is broken.
On the hospital job, reading the path aloud is what exposed the problem. The chain went "facade → MEP rough-in → medical gas → handover," which sounds sensible — until you noticed medical gas had no successor other than a constrained milestone. The path was real, but it was pinned in place artificially. Reading it as a story, not a filter result, is what makes the difference.
Pass 3 (4–6 min) — Test the logic and hunt for open ends
This is where most schedules quietly fail. Run three fast checks:
1. Open ends: activities with no predecessor or no successor (excluding the true start and finish milestones). Every open end is a piece of the programme floating free of the logic.
2. Constraints: count them. A programme with dozens of hard date constraints is not a network — it is a wish list held together with tape.
3. Leads and lags: look for negative lags (leads) and long positive lags substituting for real activities. A "FS + 30d" lag often hides a month of unmodelled work.
You do not need a full DCMA 14-point assessment in the room. You need the three checks above, which cover the failures that actually distort the completion date. For a deeper method, see the Delay Analysis learning track and the Delay Claims Library.
Treating a low "critical activity" count as good news. On one water-treatment upgrade, the contractor proudly showed only nine critical activities. The reason was 47 open-ended activities that P6 had gifted enormous float — they simply were not connected to anything. A tidy-looking critical path can be a symptom of missing logic, not disciplined planning.
Pass 4 (6–8 min) — Read the float health
Float is the programme's pulse. Instead of chasing individual numbers, look at the distribution of total float across all activities. A healthy construction programme has a gentle spread: a driving path near zero, a cluster of near-critical work, and a long tail of genuinely flexible activities.
Two shapes should make you pause. First, negative float — any activity already behind its required date. Second, a suspicious spike of very high float (a 150+ day bar dwarfing everything else). Enormous float rarely means the team has a comfortable buffer; it usually means those activities are dangling on open ends and are not being driven by anything. Both extremes tell you where to point your next question.
| Total float band | Activities | What it usually means |
|---|---|---|
| Negative float | 14 | Already late against a required date — recovery needed. |
| 0–5 days | 96 | Driving path plus near-critical work — watch closely. |
| 6–20 days | 130 | Healthy working buffer for site sequence. |
| 21–60 days | 74 | Flexible work — good, if the logic is real. |
| 61–150 days | 38 | Question mark — check for missing successors. |
| 150+ days | 210 | Warning: usually dangling open ends, not buffer. |
Pass 5 (8–10 min) — Sanity-check resources and cost
If the programme is resource- or cost-loaded, spend the final two minutes on the histogram and the S-curve. You are not auditing every unit — you are looking for physical impossibility. Does the labour histogram show 180 workers on site in a week when the site can realistically hold 60? Does the cost curve leap vertically, implying a month's spend lands in a single week? On the hospital job, the finishes trade showed a spike of concurrent subcontractor crews that no site of that footprint could absorb. That single glance reframed the whole conversation from "when do we finish" to "how is this physically staffed."
Pair the visual read with the calculators on PMMilestone — the CPI Calculator, SPI Calculator, Earned Schedule Calculator and Schedule Risk Monte Carlo — to pressure-test what the histograms imply about performance and risk.
Novice reading vs expert reading
The gap between a new planner and an experienced one is not P6 knowledge — juniors often know the software better. The gap is where attention goes in the first ten minutes.
| What they check | Novice planner | Expert planner |
|---|---|---|
| Starting point | The finish date on the printout | The data date and whether statusing is honest |
| Critical path | Trusts the Total Float ≤ 0 filter | Reads the Longest Path aloud as a build sequence |
| Logic | Assumes the network is complete | Hunts open ends, constraints and hidden lags |
| Float | Looks at one or two activities | Reads the whole float distribution shape |
| Resources | Skips it — "not my job" | Checks the histogram for physical impossibility |
| Outcome | Reports the date the software shows | Reports whether the date can be believed |
Lessons learned the hard way
A few things no training course taught me — only projects did.
Constraints are where optimism hides. The single most common way I have seen a completion date faked is a "Finish On or Before" constraint on a late milestone. It makes the maths work and the reality impossible.
Read the path as a sentence. If you cannot narrate the critical path as a plausible build story, the logic is wrong — no matter how confident the bars look.
High float is a question, not a comfort. On the hospital job, the activities with the most float were the ones nobody had connected. Comfort was actually neglect.
Trust the physical world over the software. P6 will happily schedule 200 people onto a site that holds 50. The histogram is where the programme meets reality. The Construction productivity pillar and the Project Recovery Playbooks go deeper on what to do next.
The bottom line
The ten-minute read is a habit, not a talent. Run the five passes on the next three schedules that cross your desk and the sequence stops feeling like a checklist and starts feeling like instinct — which is exactly what an experienced planner's ten minutes really is.
To go further, start at the PMMilestone Academy home, pick a Learning Track that matches your next twelve months, pair it with the relevant Knowledge Pillars, and read the methodology context on the Founder and About pages, or browse further research on the Publications page.
Frequently asked questions
Can you really assess a 4,000-activity schedule in ten minutes?
You are not reading all 4,000 activities — you are reading the structure: the data date, the driving path, the logic quality, the float shape, and the resource load. Those five things are decided by a small fraction of the activities. The rest is detail you review later, offline, if the triage tells you the programme is worth the effort.
What is the difference between the critical path and the longest path in P6?
The critical path is usually defined by total float at or below zero, which constraints can manipulate. The longest path follows the actual driving logic from start to finish regardless of float. When constraints are present, the longest path is the more honest view of what really controls the completion date.
Why do you start with the data date instead of the finish date?
The finish date is an output; the data date is the assumption everything rests on. If the data date is old or the schedule has not been statused against it, every forecast date and float value is unreliable. Checking it first stops you from analysing fiction.
Is a schedule with very few critical activities a good sign?
Not necessarily. A short critical path can mean tight, disciplined logic — or it can mean large numbers of open-ended activities that P6 has awarded artificial float. Always cross-check a lean critical path against the open-end count before you call it healthy.
Do I need the native P6 file, or is a PDF enough?
A PDF or printout lets you check framing and read the bars, but you cannot test logic, constraints, or float distribution without the live file (or at least an XER export). If a decision hinges on trust, insist on the file.
How much of this applies to Microsoft Project or other tools?
The framework is tool-agnostic. Data date, driving path, logic integrity, float distribution and resource realism exist in every serious scheduling tool. The menu locations change; the questions do not.
Next steps on PMMilestone
Use these pages to deepen the topic, verify terminology, compare real cases and move from theory into applied project controls practice.
Related calculators
Open the calculators referenced in this article and run them against your own project numbers.
SPI Calculator
Schedule Performance Index — measure schedule efficiency.
Open Earned ValueCPI Calculator
Cost Performance Index — measure cost efficiency.
Open ScheduleEarned Schedule Calculator
Time-based schedule performance (SPI(t)).
Open ForecastingTCPI Calculator
To-Complete Performance Index — required efficiency to finish on budget.
OpenOther learning tracks

Construction Claims Career Path
A practical roadmap for engineers moving from site delivery into planning, delay analysis, claims, commercial controls and senior claims consulting.

Project Controls Digital Transformation Roadmap
A future-focused guide to modern project controls through data integration, reporting automation, Power BI, AI, BIM and digital PMO capability building.
Project Controls Fundamentals
Scope, schedule, cost, risk, quality and reporting — the six disciplines that hold every successful capital project together, taught from first principles.