Risk and Reserves: Quantifying Uncertainty and Sizing Contingency Defensibly

Why risk management often fails in practice
Risk management is the most preached and least practiced project controls discipline. Most projects keep a risk register, but few use it to drive forecasts, reserves or decisions. The register lives in a spreadsheet that the team updates once a quarter and the executives never read.
The cause is usually structural. Risks are scored on subjective five-by-five matrices that produce categorical labels with no quantitative meaning. The output cannot be plugged into a forecast, so it never reaches the decisions that matter. The first step in better risk management is converting those labels into numbers a model can use.
Qualitative risk assessment — done properly
Qualitative assessment is still the right starting point. Identify the risk, describe the trigger event, articulate the consequence, and assign a probability and an impact band. The discipline is in the writing: vague risks produce vague responses, and responses that are not concrete cannot be costed.
A well-written risk register also categorises risks by source — design, procurement, construction, regulatory, external — because that classification drives both the response strategy and the ownership. A risk no one owns is a risk no one is managing.

Quantitative risk analysis
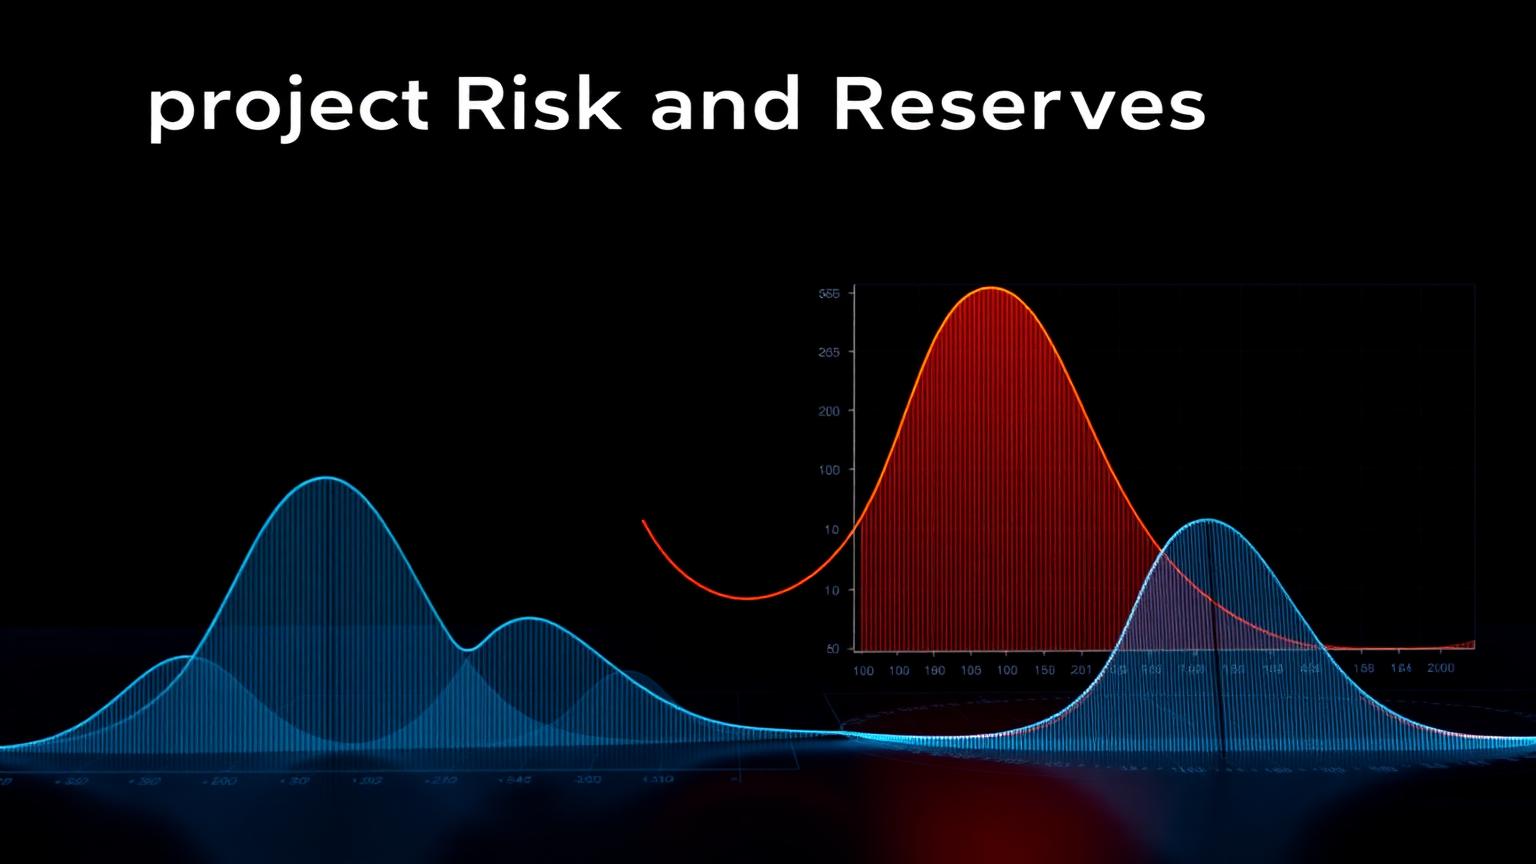
Quantitative risk analysis turns the register into numbers. Each risk is given a probability of occurrence and a cost or schedule impact expressed as a distribution rather than a single value. Monte Carlo simulation then samples thousands of combinations of these distributions to produce a probabilistic forecast of total cost or end date.
The output is a confidence curve. A P50 forecast is the value that has a 50% chance of being exceeded; a P80 forecast has a 20% chance of being exceeded. Most capital project boards size contingency to a defined confidence level — commonly P70 to P80 — based on the organisation's risk appetite.
Sizing contingency reserves
Contingency reserves are the financial expression of risk. They should be calculated, not negotiated. A defensible reserve is built from the Monte Carlo output minus the deterministic base estimate, sized to the chosen confidence level, and reported as a single number that everyone in the governance chain understands.
Two reserves usually exist side by side. Contingency reserve covers known unknowns — risks identified in the register. Management reserve covers unknown unknowns — events outside the analysis envelope. Both should be tracked, drawn down explicitly, and replenished by formal change rather than by stealth.

Complexity scoring
Two projects with similar headline budgets can have very different risk profiles. Complexity scoring is a structured way to capture the dimensions that make one project harder than another: technical novelty, stakeholder count, regulatory complexity, geographic spread, interface intensity, schedule pressure and so on.
A complexity score is not a forecast in itself, but it informs reserve sizing, governance design and resource allocation. A high complexity score in early stages is a signal to invest more in front-end planning rather than to rush into execution.
From analysis to risk-adjusted forecasts
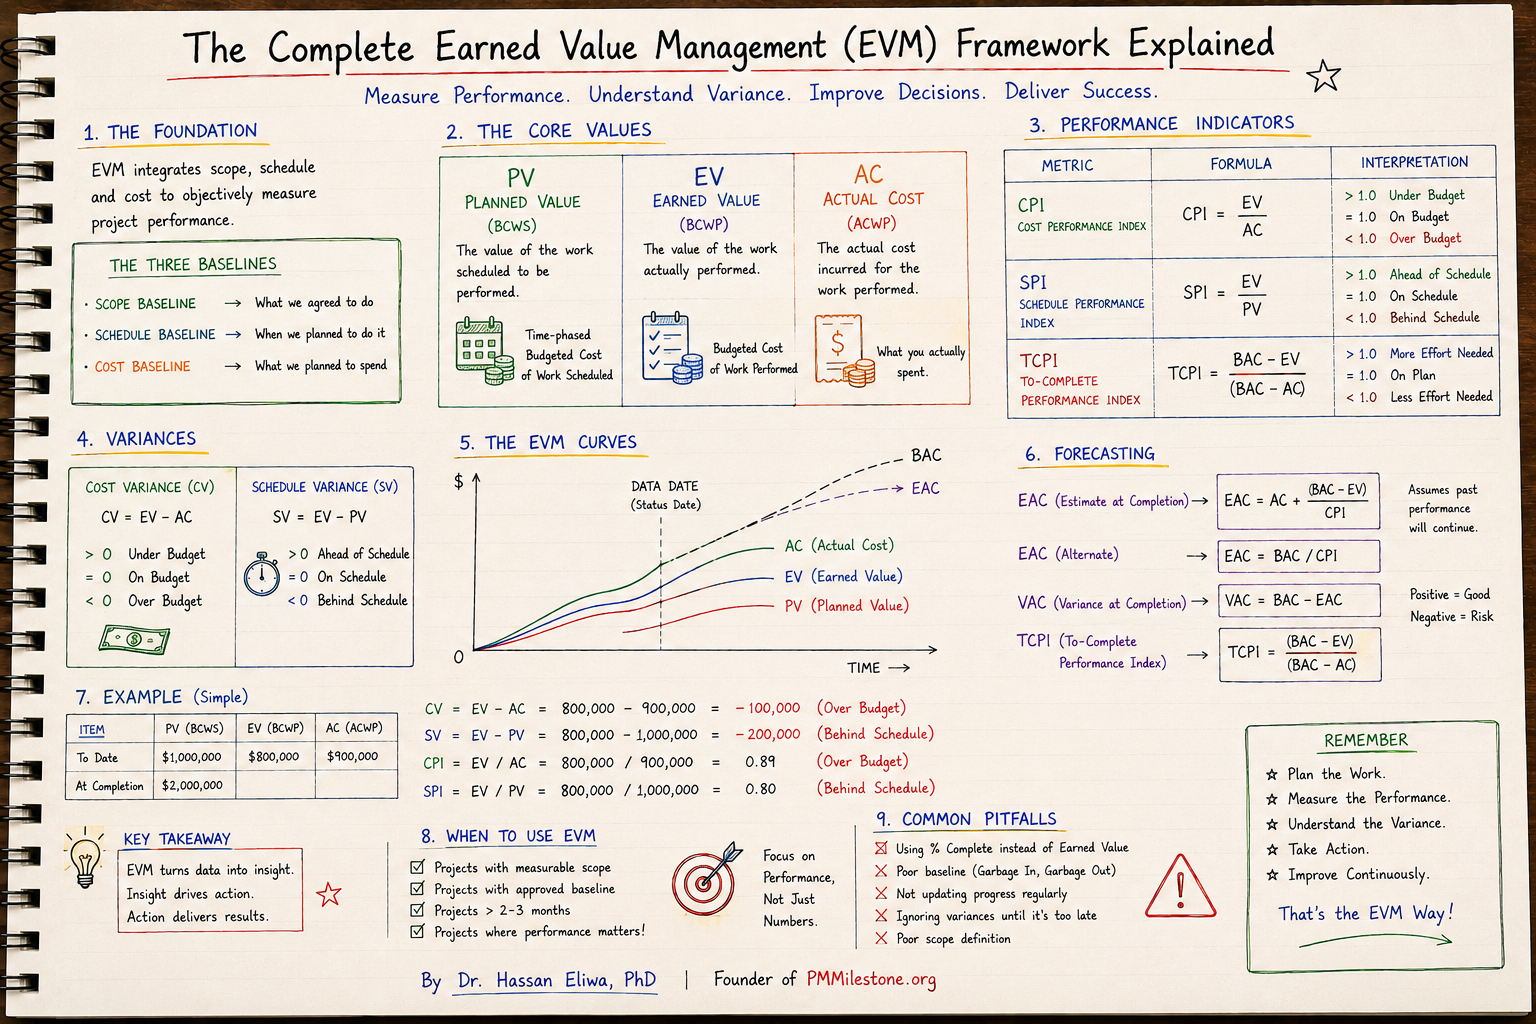
The point of quantitative risk analysis is to produce a single, integrated forecast that the project board can act on. The deterministic schedule and cost estimate become the base; the Monte Carlo output becomes the confidence band; the reserve becomes the difference. EVM, then, sits on top of a base estimate that already absorbs realistic uncertainty rather than pretending it does not exist.
This is what mature project controls feels like in practice: every number on the dashboard has a probability attached to it, every reserve has a calculation behind it, and every decision the board makes is informed by both the central estimate and the realistic range around it.
Governance and behaviour
The hardest part of risk and reserves is not analytical. It is behavioural. Project teams under deadline pressure consume contingency early and then have nothing left when real surprises arrive. Boards that do not understand confidence bands either over-spend on imagined risk or under-spend on real risk.
Strong governance treats reserves as a project-level asset, requires evidence to draw them down, and reports drawdown alongside performance. Done well, this turns risk management from a paperwork exercise into a competitive advantage.
How to discuss reserves with executives
Reserve conversations fail when controls teams present contingency as a cushion rather than as the priced expression of uncertainty. Executives need to see the link between named risks, quantified exposure, confidence level and drawdown rules. A strong reserve recommendation therefore shows the base estimate, the probabilistic range, the confidence point selected, and the governance trigger for using the money.
The language matters. Instead of saying that a project needs ten percent contingency, say that the current risk model indicates a P80 requirement of a specific amount, driven mainly by procurement lead-time risk, design maturity and interface uncertainty. That framing makes the reserve auditable. It also protects the project team from the common mistake of cutting contingency to make the business case look better while leaving the risk unchanged.
Next steps on PMMilestone
Use these pages to deepen the topic, verify terminology, compare real cases and move from theory into applied project controls practice.
Related calculators
Open the calculators referenced in this article and run them against your own project numbers.
Other learning tracks
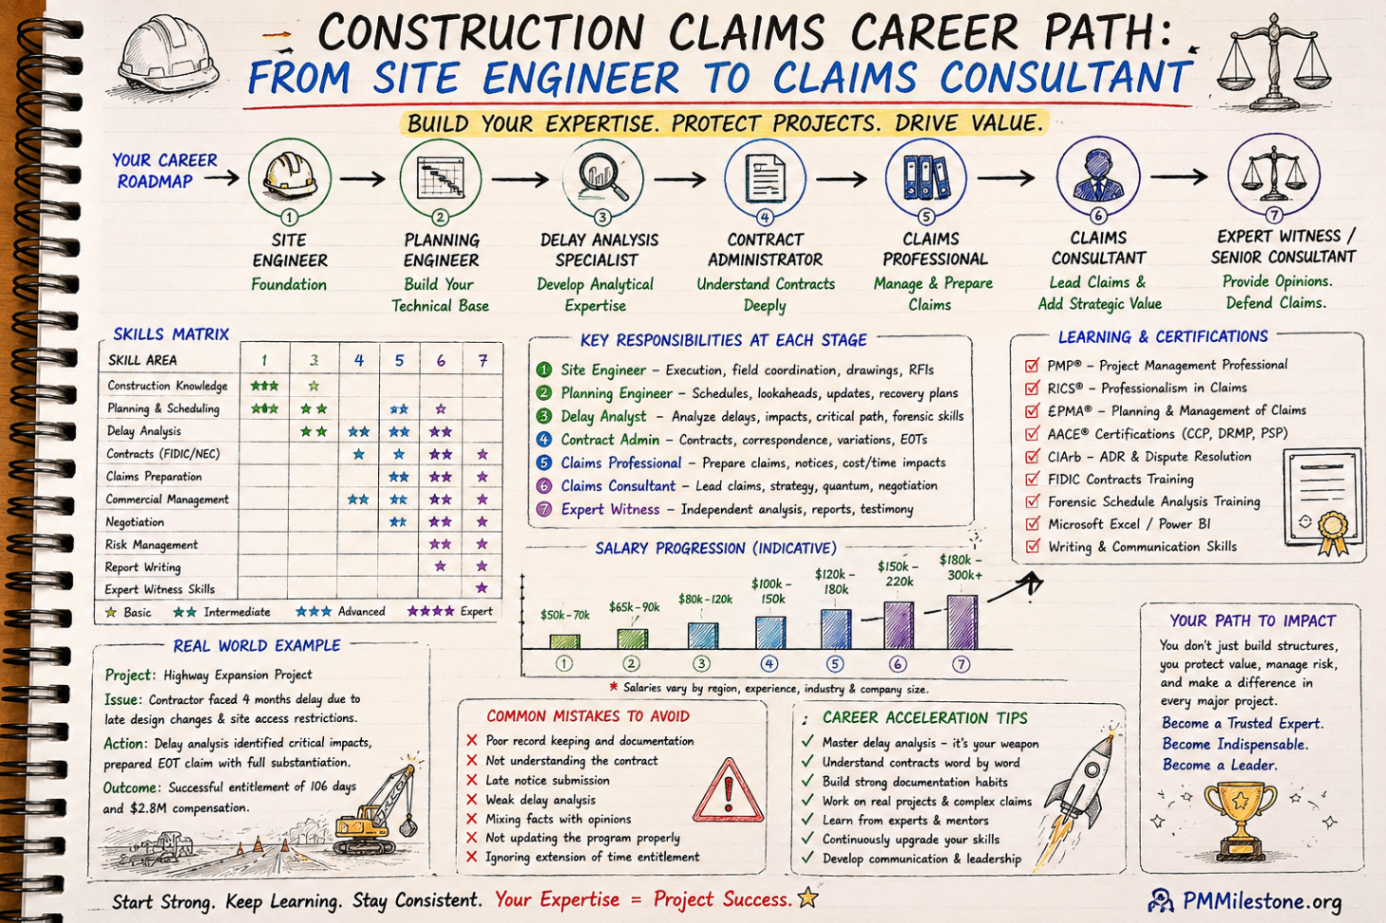
Construction Claims Career Path
A practical roadmap for engineers moving from site delivery into planning, delay analysis, claims, commercial controls and senior claims consulting.
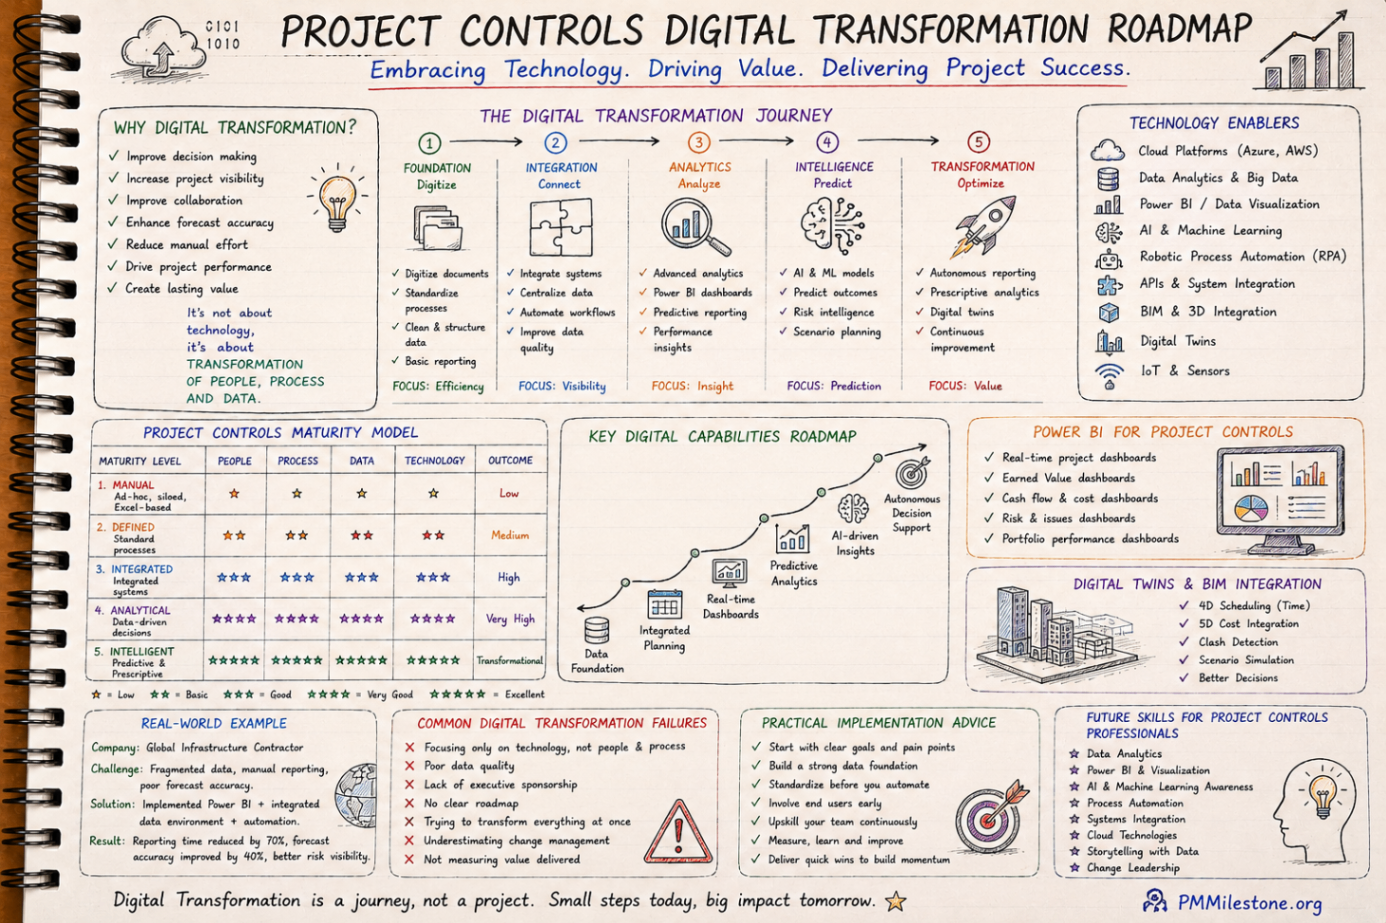
Project Controls Digital Transformation Roadmap
A future-focused guide to modern project controls through data integration, reporting automation, Power BI, AI, BIM and digital PMO capability building.
Project Controls Fundamentals
Scope, schedule, cost, risk, quality and reporting — the six disciplines that hold every successful capital project together, taught from first principles.