Stop Writing Weekly Reports: Build an AI Project Manager That Writes Them For You


The Friday afternoon every planner knows
Every planner I know has lived the same Friday afternoon. The job is winding down, the site is quiet, and instead of going home you are stitching a weekly report together from twelve different places — an inbox with 127 unread emails, a Teams channel still pinging, a Primavera P6 update you ran an hour ago, a cost report that does not quite reconcile, and a fistful of sticky notes from a site walk you half-remember. You are not really analysing anything. You are hunting, copying and reformatting. By the time the report goes out, the insight that mattered is buried on page three, and you have spent the best part of a day producing a document most people will skim in ninety seconds.
After twenty-odd years building schedules and running project controls on infrastructure programmes — water, transport, the kind of work measured in hundreds of millions — I have come to a blunt conclusion. The weekly report is not the problem. Remembering everything is the problem. The report is just the moment the forgetting catches up with you. This article is a practical walk-through of how to flip that around: how to set up an AI project manager — I use Claude — that captures the noise as it happens and writes the report for you, so your time goes back into judgement, not formatting.
The pattern in this guide pairs naturally with the Will AI replace project managers by 2030? framework, the PMO reporting pillar and the Dashboard Design Masterclass.
On most programmes, the expensive failures are not technical. They are failures of memory and handover — a decision nobody can trace, a commitment that fell through a gap, an early warning that was raised but never tracked. An AI that remembers the whole project does not replace your judgement. It removes the excuse that you couldn't have known. The pattern is visible across the Project Failure Database and the Mega Project Case Studies.

The real problem isn't reports — it's recall
On a live job, information arrives faster than any human can file it. A subcontractor mentions a two-week delay on a phone call. A design change lands in an email at 6pm. A decision gets made in a corridor and never written down. A risk gets flagged in a meeting, nodded at, and quietly forgotten until it becomes an issue. None of this is laziness — it is simply the physics of delivery. The volume beats the bandwidth.
The cost shows up later. Three months on, someone in a steering meeting asks why a package slipped, and the honest answer is that nobody can reconstruct the chain of events. The emails are scattered, the meeting notes are in someone's notebook, and the person who actually knew has rolled off to another project. The knowledge was never lost in a dramatic way. It just evaporated, a little at a time.
From scattered inputs to one project brain
The shift that changes everything is deciding to capture once and use forever. Instead of every report, register and summary being rebuilt by hand from raw sources, you feed those sources into one place that understands them — and then ask it for whatever view you need. Emails, Teams chat, meeting notes, site photos, the daily diary, P6 updates, cost reports and risks all flow in. Out the other side come the weekly report, the executive summary, the risk register, the issue log, the action tracker, the lessons learned and the decision log.
The operating-system model: many inputs flow into one project memory, which produces every report and register on demand, traceable back to the underlying facts. It is the same set of facts every time, so the weekly report, the cost report and the board pack stop telling three slightly different stories.
- Emails & Teams chat
- Meeting notes
- Site photos & voice notes
- Daily diary
- Primavera P6 updates
- Cost reports
- Risk register signals
- Understands context
- Connects everything
- Remembers forever
- Always available
- One source of truth
- Weekly & daily reports
- Executive summary
- Risk register & issue log
- Action tracker
- Lessons learned
- Look-ahead plan
- Decision log

Where the reporting week actually goes
Before we talk tools, it helps to see where the hours leak. I tracked my own reporting week on a station fit-out package and broke it down honestly. The analysis — the part that needs a human brain — was the smallest slice. Everything else was logistics.
Read the table twice. The win is not only the four-and-a-half hours saved. It is that analysis time more than doubles. When the machine handles the chasing, reconciling and formatting, you finally have room to ask the question that matters: so what?
| Activity | Manual hours | What it actually is | AI-assisted hours |
|---|---|---|---|
| Chasing updates | 3.0 | Emails and Teams pings to get current status | 0.3 |
| Reconciling data | 2.5 | Making P6, cost and registers agree | 0.4 |
| Formatting & layout | 1.5 | Copying into the template, fixing tables | 0.2 |
| Actual analysis | 0.5 | Judgement: what it means, what to do | 1.1 |
| Total per report | 7.5 h | — | 2.0 h |
What 'capture once' looks like on site
The theory is fine; the value lives in the daily mechanics. The biggest single source of lost project knowledge is the site itself, because that knowledge is verbal, fast and easy to lose. A daily diary that writes itself is the highest-leverage habit I have introduced on any job.
The workflow is almost embarrassingly simple. During a site walk you speak instead of type — a thirty-second voice note for each thing worth recording: "Pour to Level 3 slab held up, ready-mix truck stuck behind the closed access road, lost about two hours." You snap a photo. You move on. At the end of the day the AI has turned those fragments into a structured daily diary, a running timeline, a delay-evidence file and a photo log — each entry time-stamped and searchable.
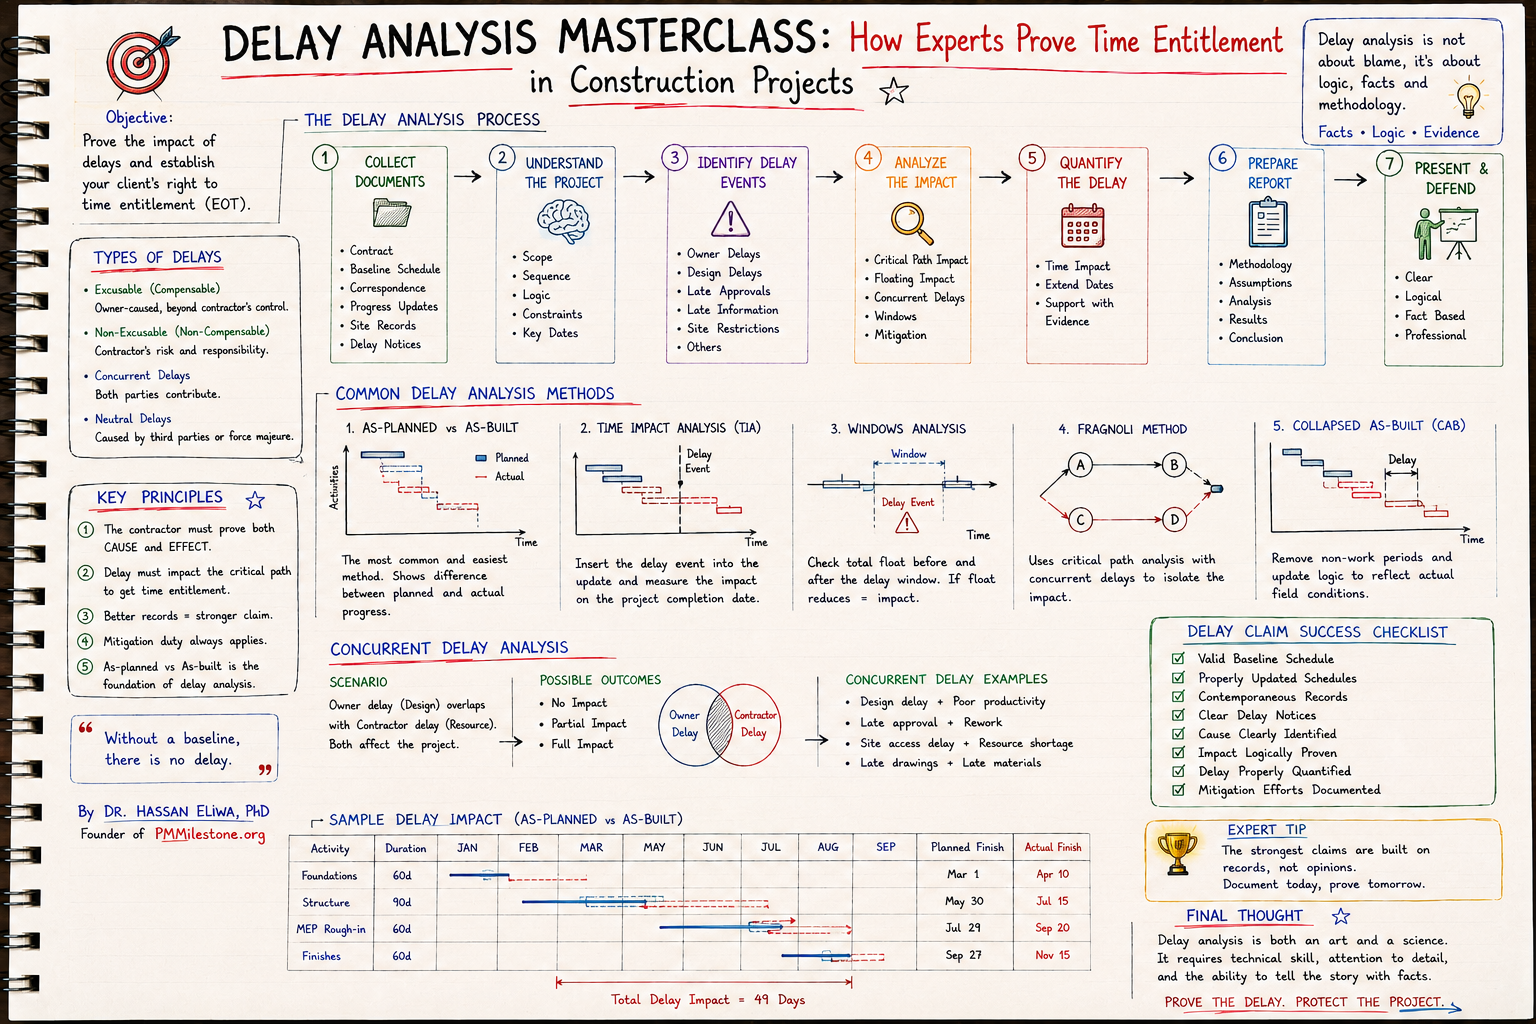
On a road-widening job we ran into an extension-of-time claim eight months after a wet-weather period. The contractor's records were thin; ours were not. Because every rain day, every stood-down crew and every access restriction had been captured the day it happened — with photos and a timeline — we could reconstruct the critical-path impact in an afternoon. Contemporaneous records win claims. An AI diary makes "contemporaneous" the default instead of the exception. The same principle runs through the Delay Claims Library and the Delay Analysis Masterclass.

Meetings should create decisions, not paperwork
The second great leak is the meeting. We hold them constantly, and then we spend the evening writing up minutes that arrive too late to matter and an actions list that no one quite owns. Let the AI sit in the meeting — on the transcript — and the output is immediate: a summary, an action register with named owners and dates, a decision log, and a follow-up email drafted and ready to send.
Two features matter more than people expect. First, it identifies action owners — it does not just list "someone will check the rebar schedule," it pins the name and the date raised. Second, it detects unresolved actions carried over from previous meetings, which is exactly the stuff that slips. The minutes stop being a record of what was said and become a tracker of what is actually moving.
Keep the human in the loop on the send button. Let the AI draft the follow-up email and the minutes, then read them and send. Two minutes of review preserves your accountability while keeping the time saving. The goal is leverage, not abdication.

When someone asks why Package C slipped
This is where the whole idea earns its keep. Picture the monthly steering meeting. A director leans forward and asks the question every project lead dreads: "Why has Package C been delayed since February?" In the old world you promise to come back with an answer, then spend two days excavating emails. With a project that remembers, you answer in the room.
Because the meeting notes, emails, decisions, risk register, action log, photos, schedule changes and progress reports all live in one connected memory, the answer comes back complete: Package C slipped due to a sequence of design changes in February, a supplier issue on long-lead steel, two late approvals, and a resource clash with another package. Not a guess. Not a defensive half-story. The actual causal chain, with the evidence attached.
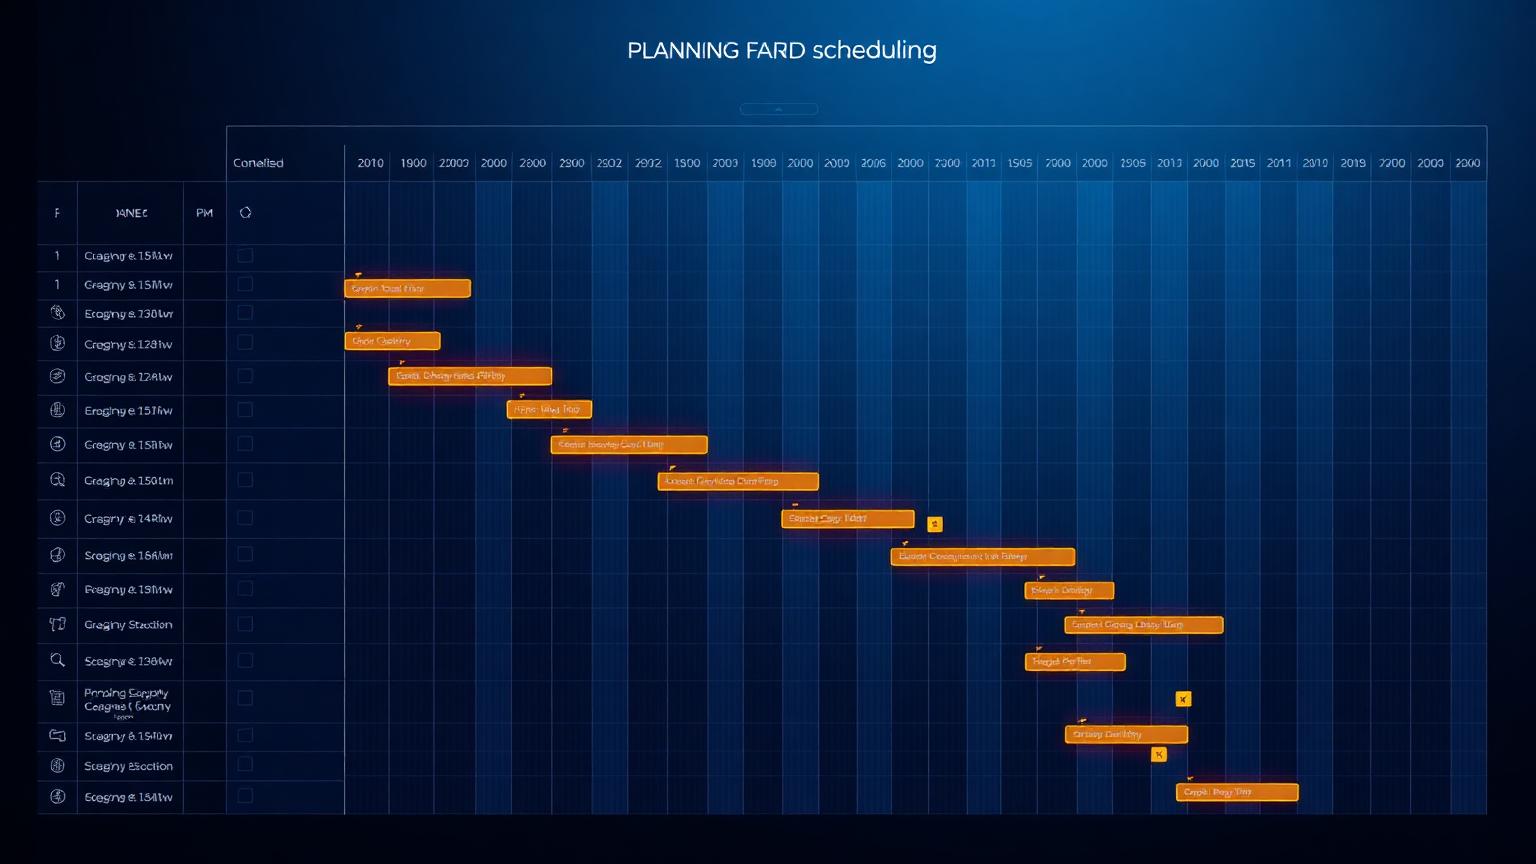
A Gantt view like the one below is not decoration. When the AI maintains the link between the schedule and the narrative, the chart and the explanation stay in sync. The director sees the slipped bars, hears the four causes, and the conversation moves straight to recovery options instead of stalling on "let me find out." That is the difference between a project manager who reports the past and one who can interrogate it — the skill explored in depth across our EVM framework and forecasting framework pillars.
| Package activity | Baseline (week) | Current forecast | Status |
|---|---|---|---|
| Design — Package C | 5–9 | 6–11 | Slipped |
| Procurement (steel) | 5–9 | 8–13 | Slipped |
| Piling & foundations | 8–12 | 10–14 | On track |
| Substructure | 12–16 | 13–19 | On track |
| Superstructure | 18–25 | 18–27 | Slipped |
| Services & fit-out | 24–29 | 26–31 | On track |

Turning project signals into early warnings
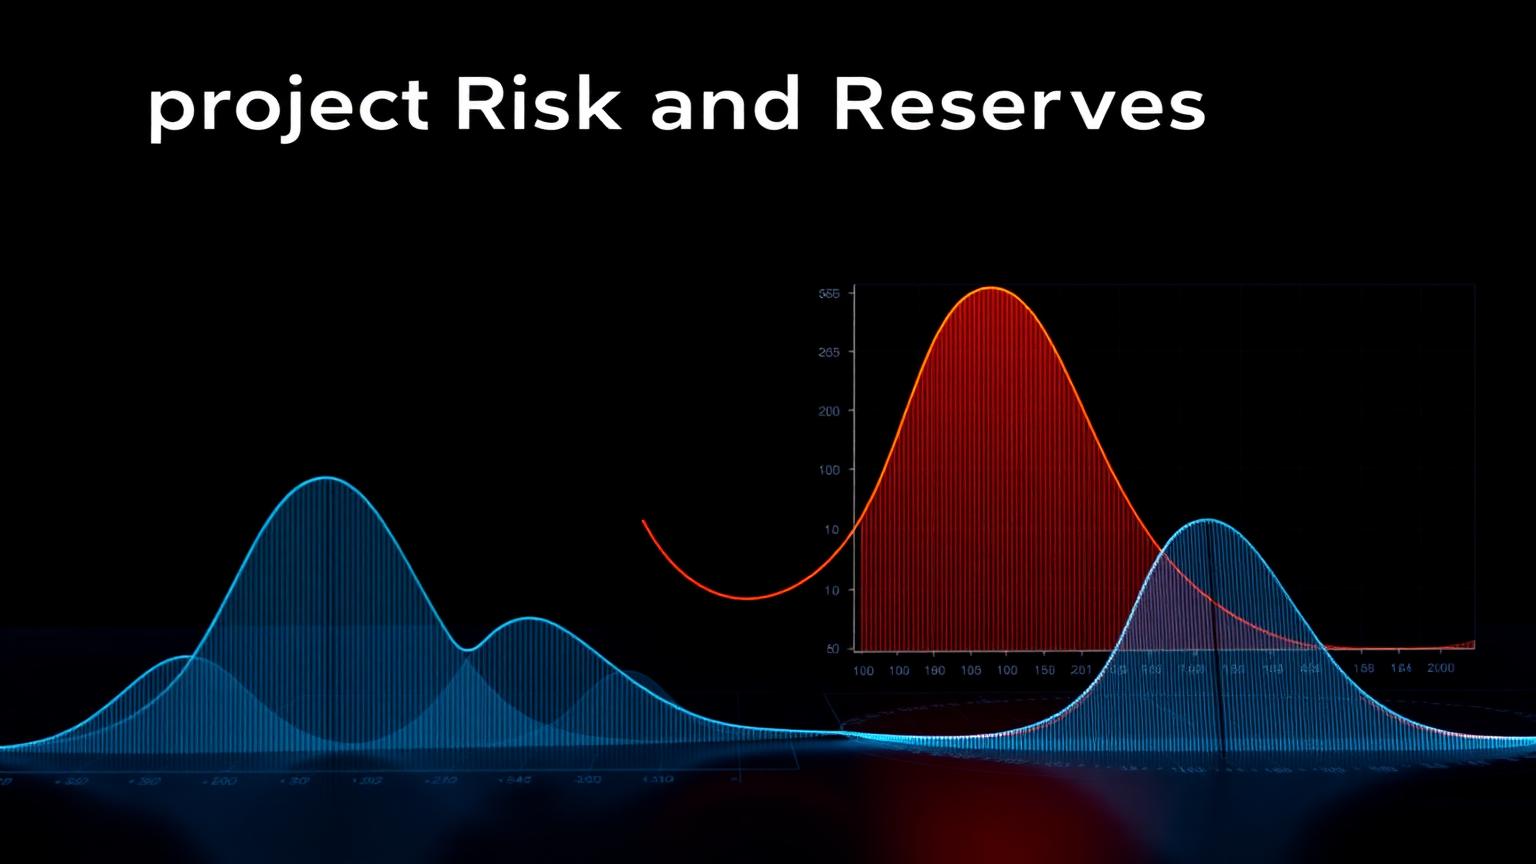
Reporting tells you what already happened. The more valuable move is to read the same data as a set of early-warning signals. Schedule changes, late approvals, budget variance, a spike in a particular kind of email, contractor issues, weather and site reports are all leading indicators if you connect them. An AI that watches them continuously can flag a risk while it is still cheap to manage.
The output is a living risk register — each risk carrying a probability, an impact score, an owner, a mitigation plan and, crucially, a trend. A material delay sitting at medium but trending up is a very different animal from one trending down, and the trend is the thing humans forget to track. Pair this view with the calculators on PMMilestone — the CPI Calculator, SPI Calculator, Earned Schedule Calculator and Schedule Risk Monte Carlo — to pressure-test the trend yourself.
| ID | Risk | Prob. | Impact | Trend | Level |
|---|---|---|---|---|---|
| 1 | Design change — Package C | 80% | 5 | ↗ rising | HIGH |
| 2 | Late approval (consent) | 60% | 4 | ↗ rising | HIGH |
| 3 | Long-lead material delay | 50% | 4 | → stable | MEDIUM |
| 4 | Resource shortage | 40% | 3 | ↗ rising | MEDIUM |
| 5 | Weather impact | 20% | 2 | → stable | LOW |

Your entire project on one screen
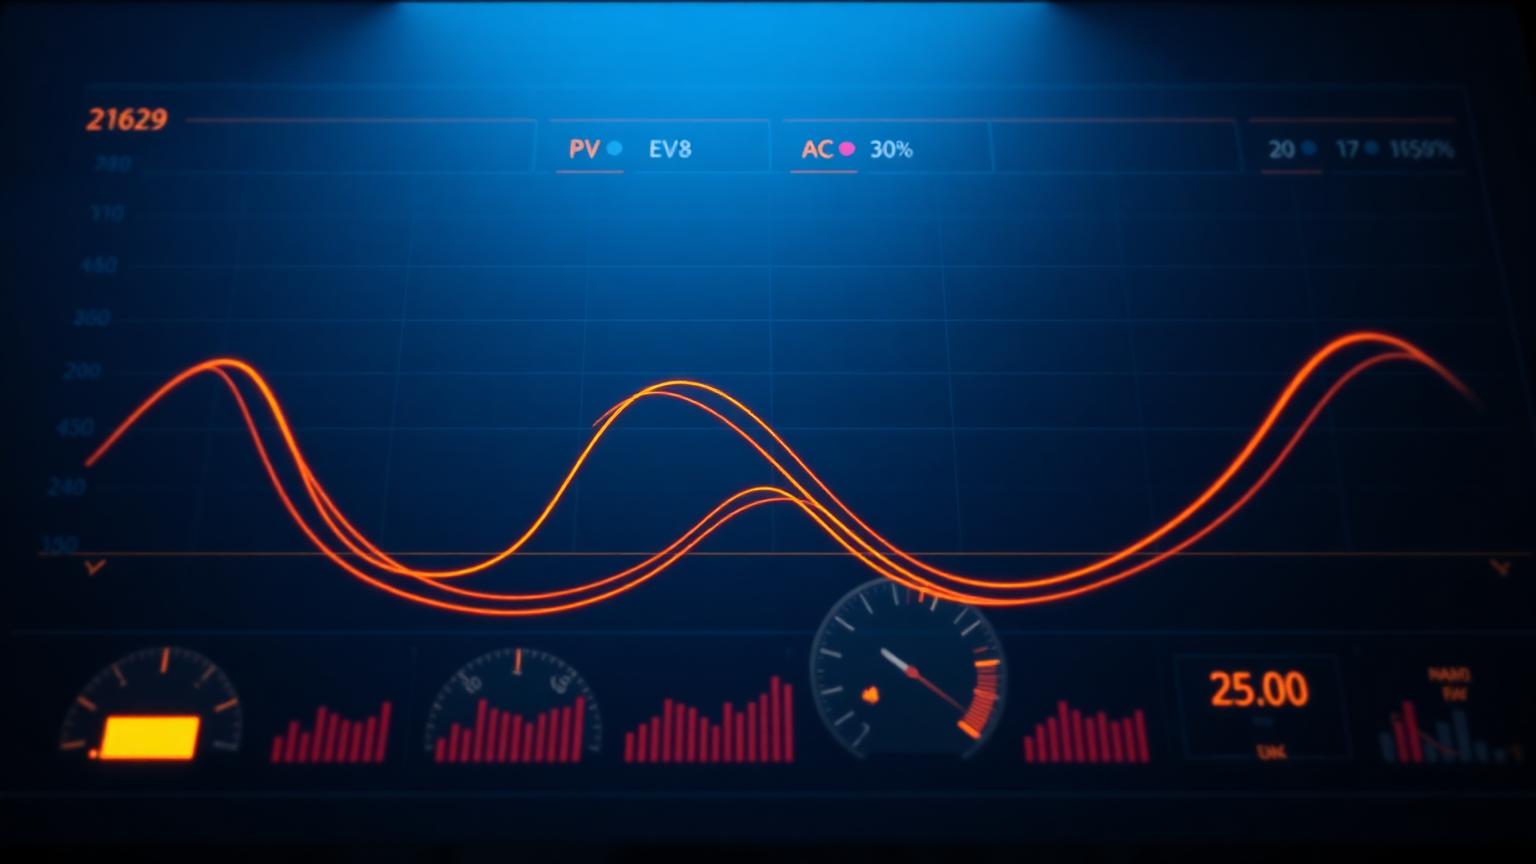
Executives do not want more data; they want better decisions, faster. The final output of the system is an executive dashboard that pulls from Primavera, Power BI, Excel, the daily diary, meeting notes, the risk register and cost reports, and renders the whole project at a glance — SPI and CPI, the S-curve, cost and schedule performance, top risks, action status and a single health score.
The quiet benefit is consistency. When the board pack, the weekly report and the cost report all draw from one source, they agree. No more reconciling three numbers for the same metric an hour before a meeting because the spreadsheet, the schedule and the slide deck were each updated by a different person on a different day. One source of truth, zero wasted hours. For deeper templates, see the PMO Dashboard Gallery and the PMO reporting framework.

Manual reporting vs an AI project manager
Side-by-side, the difference is not subtle. The right way to read this table is as a redeployment of where your week goes, not a headcount reduction.
| Dimension | Manual reporting | AI project manager |
|---|---|---|
| Effort per report | 6–8 hours, every week | Minutes to review |
| Data consistency | Three sources, three answers | One source of truth |
| Memory / recall | Lives in people's heads | Captured and searchable |
| Risk visibility | Reactive, found late | Trended, flagged early |
| Meeting actions | Often lost or unowned | Owned, dated, tracked |
| Claims evidence | Reconstructed under pressure | Contemporaneous by default |
| Where your time goes | Chasing and formatting | Judgement and decisions |
A practical way to start — without boiling the ocean
You do not need to digitise an entire programme on day one. The teams that succeed start narrow, prove the value, then widen. Here is the sequence I recommend.
1. Pick one package and one report. Choose your most painful weekly report on a single work package. Constrain the scope so you can see results in a fortnight.
2. Pour in the real sources. Connect the genuine inputs for that package — emails, meeting notes, the P6 update, the cost line. The AI is only as good as what you feed it.
3. Generate, then correct. Let it draft the report. Where it gets something wrong, tell it why. This is teaching, and it compounds quickly.
4. Add the daily diary. Once reporting works, start the voice-note diary habit. This is where the deepest memory is built.
5. Scale to the programme. Only after one package is humming do you roll the pattern out. Standardise the structure so every package feeds the same brain. The fundamentals it sits on top of are covered in the 5-Year Project Controls Roadmap and the Software Learning Path.
Common mistakes (and how to avoid them)
✗ Treating it as a writing tool. People ask the AI to "write a nicer report" and stop there. The value is the connected memory underneath, not the prose. Feed it the data first.
✗ Feeding it junk and expecting gold. If your P6 logic is broken and your cost codes are a mess, the AI will faithfully report broken, messy facts. Fix the source discipline; the tool amplifies whatever you give it. Definitions in the Project Controls Glossary are a good place to align the team's language first.
✗ Removing the human from accountability. Auto-sending unreviewed minutes or reports is how errors get a signature. Keep a human on every outbound communication.
✗ Boiling the ocean. Trying to onboard an entire $1B programme in week one guarantees a stalled pilot. Start with one painful report.
✗ Confusing activity with insight. Generating ten reports a week is not progress if nobody acts on them. Tie every output to a decision — and use the Project Recovery Playbooks when those decisions trigger a recovery move.
Expert tips from the field
Standardise your structure before you scale. A consistent WBS, risk taxonomy and naming convention is what lets one brain serve a whole programme. Messy structure means messy memory.
Capture decisions, not just status. Status ages in days; decisions matter for years. Make sure the why behind every choice is recorded — that is what saves you in month nine.
Voice beats typing on site. Nobody types a proper diary entry in the rain. A thirty-second voice note gets captured; a "I'll write it up later" does not.
Review the trend, not just the number. A risk's direction of travel tells you more than its current score. Make trend a standing column in every register.
Let the tool free you for the hard part. The time you reclaim is meant to go into judgement — recovery planning, stakeholder management, the genuinely difficult calls. Spend it there. For the bigger picture on where the role is heading, read Will AI replace project managers by 2030? and explore further research on the Publications page.
The bottom line
The problem isn't writing reports. The problem is remembering everything. An AI project manager that captures once and uses forever turns the weekly report from a Friday tax into a by-product of a system that already knows what happened. Your hours go back into the parts of the job that need a human — judgement, recovery, relationships and decisions.
To go further, start at the PMMilestone Academy home, pick a Learning Track that matches your next twelve months, pair it with the relevant Knowledge Pillars, and read the methodology context on the Founder and About pages.
Frequently asked questions
Will an AI project manager replace planners and project controls professionals?
No. It replaces the low-value parts of the job — chasing updates, reconciling spreadsheets, formatting documents — not the judgement. Schedule logic, recovery strategy, stakeholder management and risk decisions still need an experienced human. What changes is that you spend your hours on those things instead of on assembly.
Is my project data safe if I feed it into an AI?
Data governance is a legitimate concern and should be settled before you start, not after. Agree with your client and IT team where data lives, what may and may not be shared, and which records are commercially sensitive. Treat the AI like any other system that touches project information — under your data policy, not outside it.
How accurate are the reports it produces?
As accurate as the inputs. If your P6 update is clean and your cost data reconciles, the output is reliable and traceable. If the sources are wrong, the report will faithfully repeat the error — which is exactly why a human review step stays in the loop on anything that leaves the project.
Do I need to replace Primavera P6, Power BI or my existing tools?
No, and you shouldn't. The AI sits on top of your existing stack and connects it. P6 stays your scheduling engine, Power BI stays your visual layer, Excel stays Excel. The AI is the layer that reads across all of them and remembers.
How long before it pays for itself?
On most teams, the first painful weekly report shows a saving inside a fortnight. The bigger return — the avoided claim, the risk caught early, the decision traced in a steering meeting — shows up over months, and it dwarfs the time saving.
Where should a small team or a single contractor begin?
With the daily diary. It is the lowest-effort, highest-evidence habit you can build, it needs no programme-wide rollout, and it pays you back the first time you face a delay or a claim. One person speaking thirty-second voice notes on a site walk is enough to start.
Next steps on PMMilestone
Use these pages to deepen the topic, verify terminology, compare real cases and move from theory into applied project controls practice.
Related calculators
Open the calculators referenced in this article and run them against your own project numbers.
CPI Calculator
Cost Performance Index — measure cost efficiency.
Open Earned ValueSPI Calculator
Schedule Performance Index — measure schedule efficiency.
Open ScheduleEarned Schedule Calculator
Time-based schedule performance (SPI(t)).
Open ForecastingTCPI Calculator
To-Complete Performance Index — required efficiency to finish on budget.
Open PMOPM Maturity Assessment
Score PM maturity across 5 dimensions.
OpenOther learning tracks

Construction Claims Career Path
A practical roadmap for engineers moving from site delivery into planning, delay analysis, claims, commercial controls and senior claims consulting.

Project Controls Digital Transformation Roadmap
A future-focused guide to modern project controls through data integration, reporting automation, Power BI, AI, BIM and digital PMO capability building.
Project Controls Fundamentals
Scope, schedule, cost, risk, quality and reporting — the six disciplines that hold every successful capital project together, taught from first principles.