Mega Project Learning Path: How Large Infrastructure Projects Are Controlled

Why mega projects need a different control system
Mega projects — capital programmes typically above one billion dollars — fail at rates the standard project management literature does not predict. Oxford research by Bent Flyvbjerg documents that roughly 70% exceed budget and around half overrun schedule, often by 30% or more. The causes are structural, not personal: optimism bias baked into sanction estimates, scope evolution after approval, thousands of interfaces between contractors, political pressure on reporting, and governance that moves slower than the work it is supposed to steer.
Because the causes are structural, the control system has to be too. Techniques that work on a $50 million building — one schedule, one cost report, one risk register, one strong project manager — do not scale by simply adding people. Large infrastructure projects are controlled through layered governance, a dedicated PMO, an integrated master schedule, earned value at scale, quantified risk and a reporting machine that creates a single version of the truth across dozens of organisations.
This learning path walks through each layer in the order a practitioner should study them. Pair it with the Project Controls Glossary for terminology, the Mega Project Case Studies for worked examples, and the Project Failure Database for the documented evidence of what happens when these layers are missing.
Layer 1 — The governance spine: owners, boards and stage gates
Every well-controlled mega project starts with a governance spine: a clear hierarchy of decision rights from the owner's board, through a steering committee, to the project director and the delivery teams. The spine is operationalised through stage gates — formal evidence-based reviews between phases (concept, feasibility, definition, execution, close-out, or FEL-1/2/3 in oil and gas). At each gate the project must demonstrate scope clarity, schedule maturity, cost confidence and risk understanding before more capital is released.
The single most reliable predictor of mega project trouble is gates that always pass. A held gate is a successful governance event: it stops a weak definition becoming a sanctioned commitment. Study the governance failures catalogued in the Project Failure Database — gates passed without evidence and baselines changed without discipline appear in almost every entry.
Alongside gates sits baseline and change governance: the baseline is set formally, changed only through a change control board with full impact assessment, and every revision is archived. On programmes with hundreds of contract packages, that archival discipline is also the foundation of claims defence years later.
Layer 2 — The PMO operating model on large programmes
On a mega project the PMO is not an administrative support office; it is the operating system of the programme. It owns the standards every contractor must follow — WBS and coding structures, progress measurement rules, reporting calendars, data formats — and runs the integration machinery that turns dozens of contractor submissions into one coherent programme picture each month.
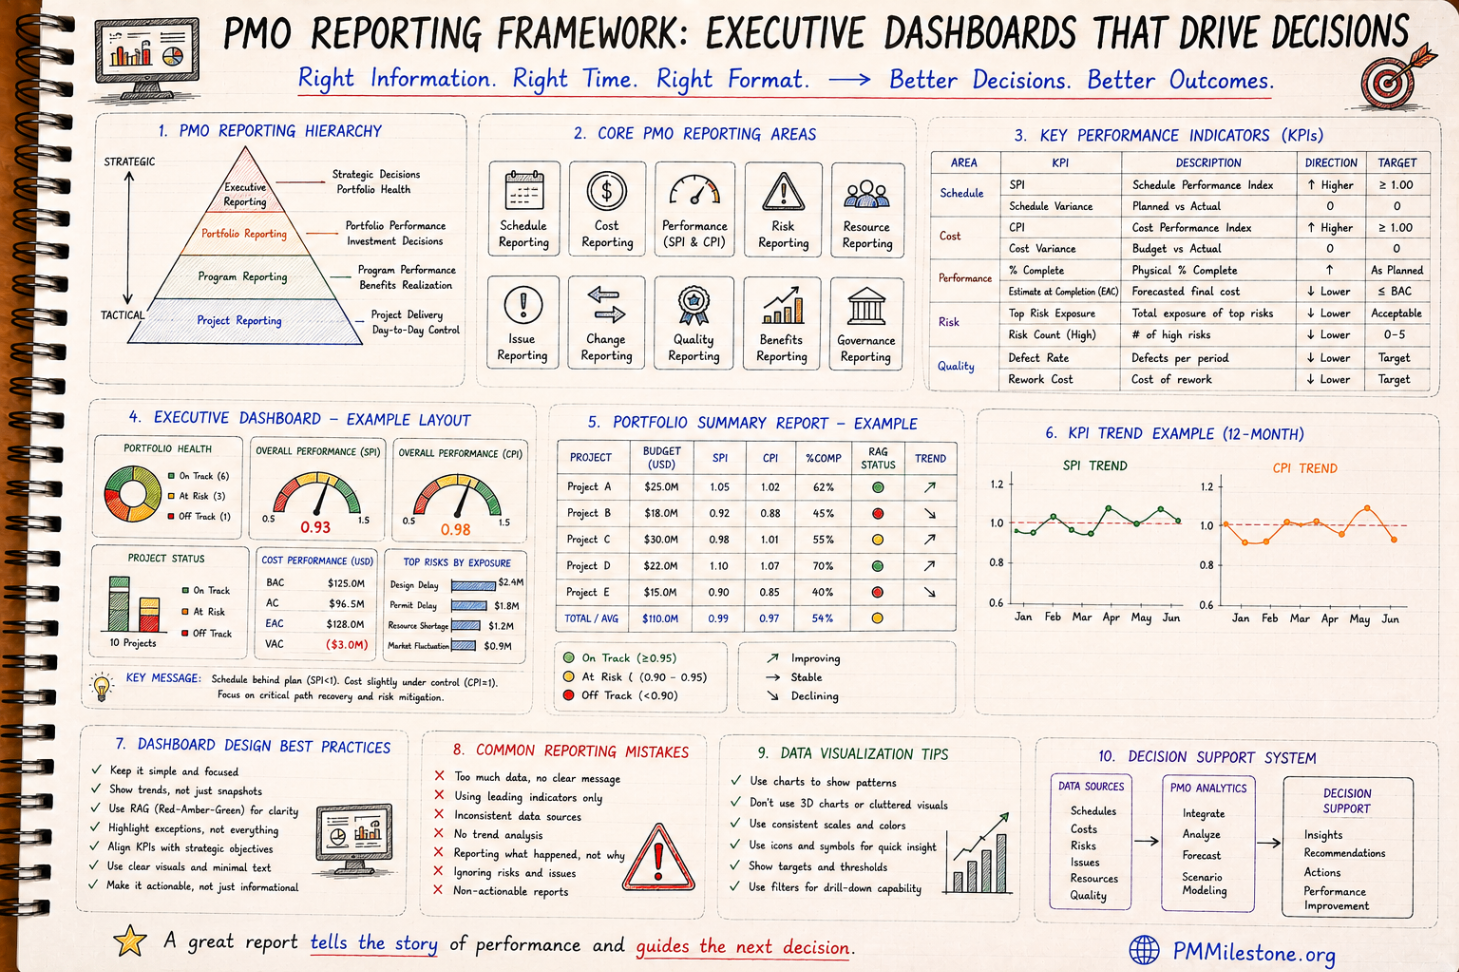
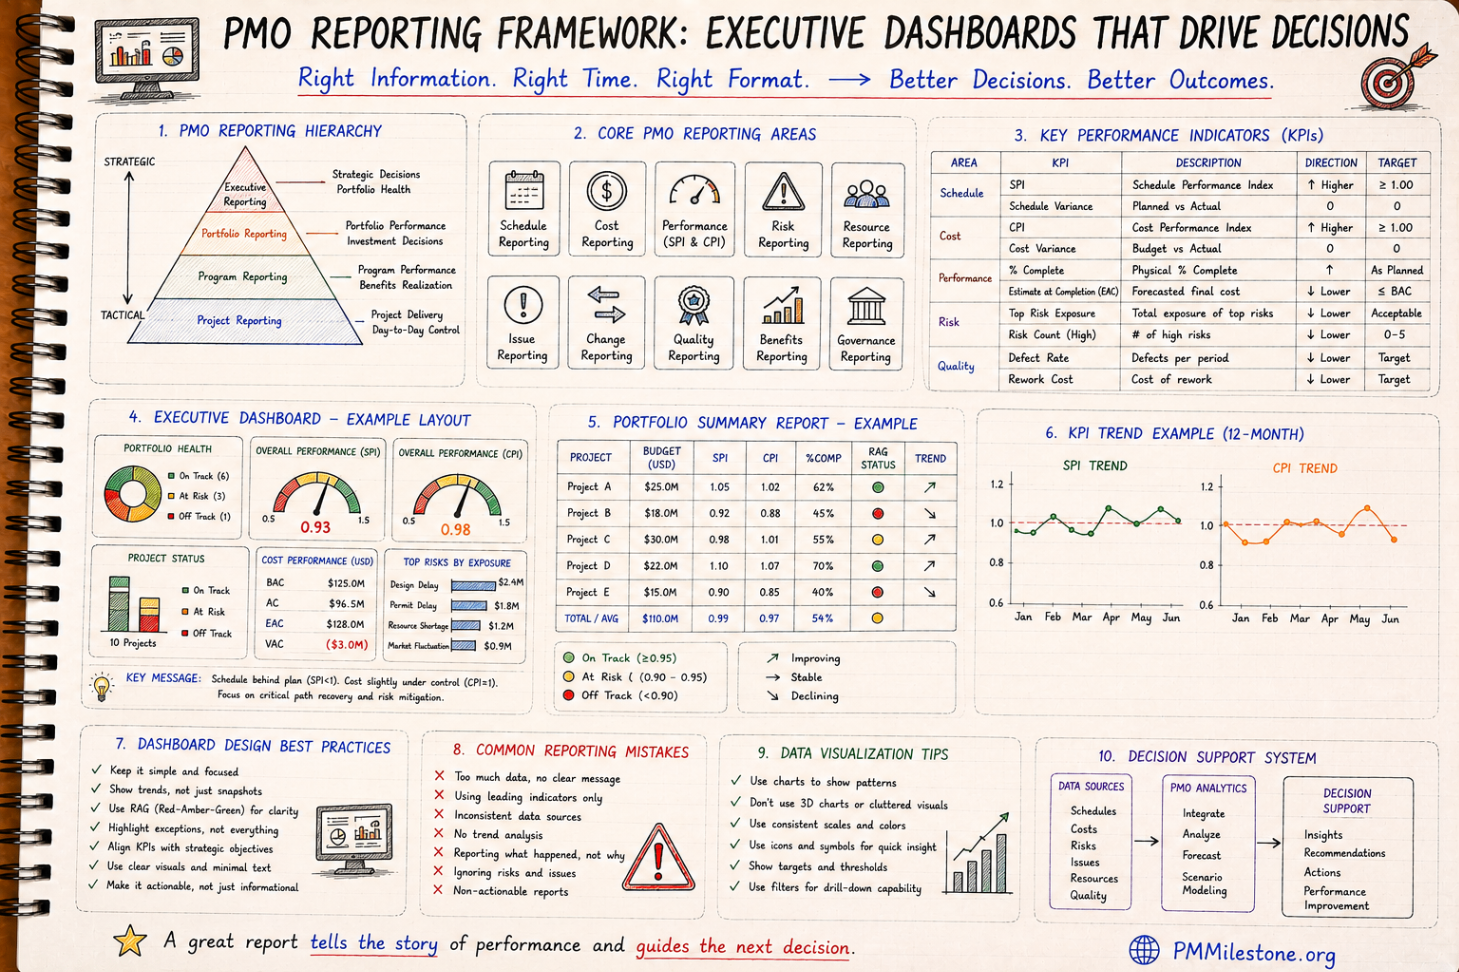
A mature mega-project PMO runs on a fixed rhythm: weekly progress and lookahead reviews at delivery level, monthly integrated performance reviews at programme level, and quarterly deep dives with the owner and board. The PMO Reporting & Executive Dashboards pillar covers the cadence design, and the PMO Dashboard Gallery shows what decision-grade outputs look like.
Benchmark any PMO you join or build with the PM Maturity Assessment — most programme problems trace back to a PMO that reports activity instead of enforcing standards.
Layer 3 — The integrated master schedule
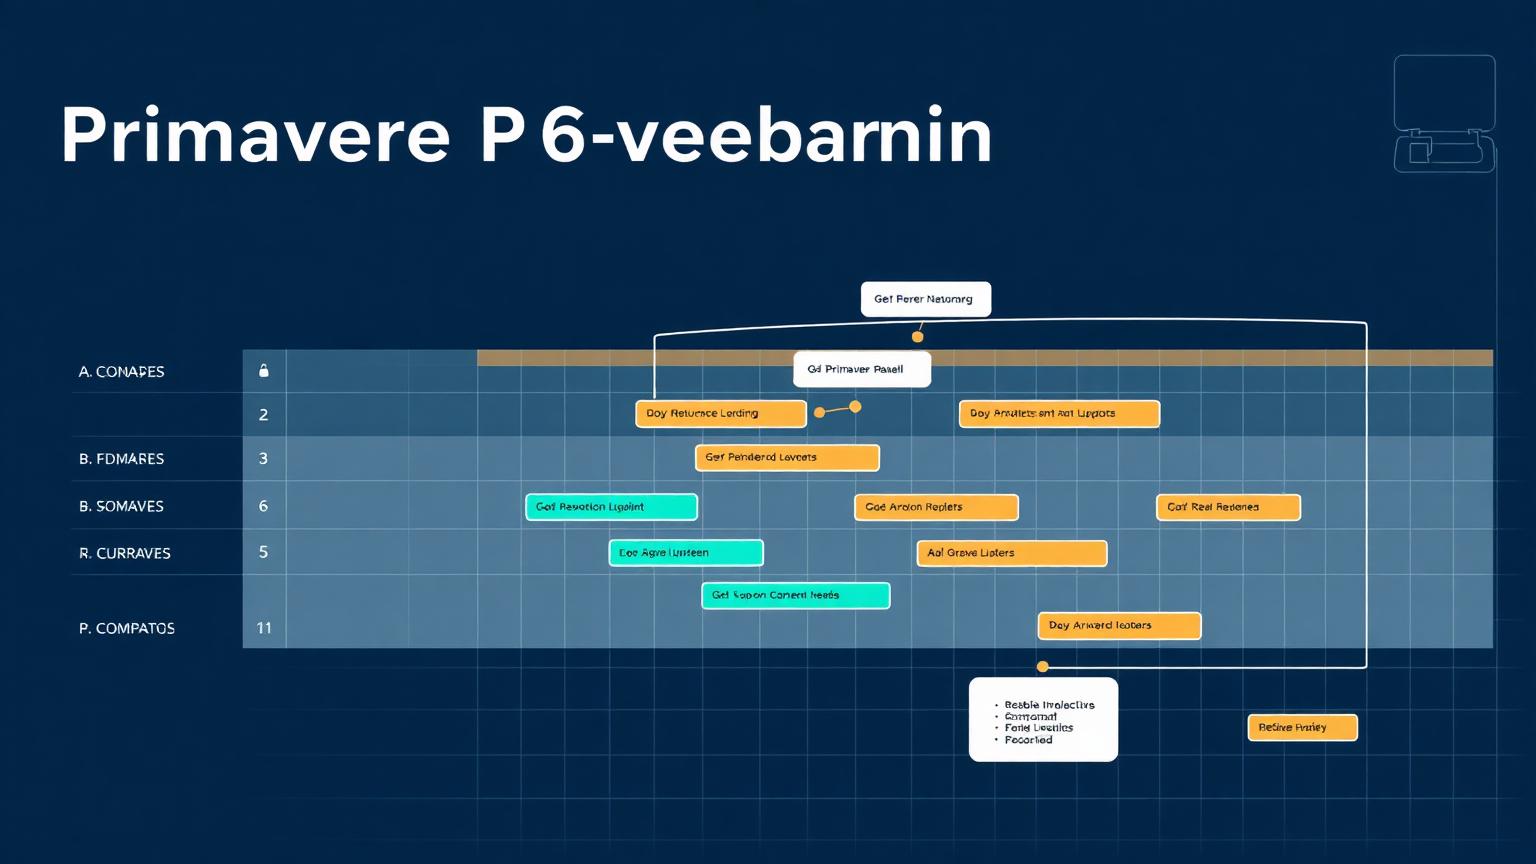
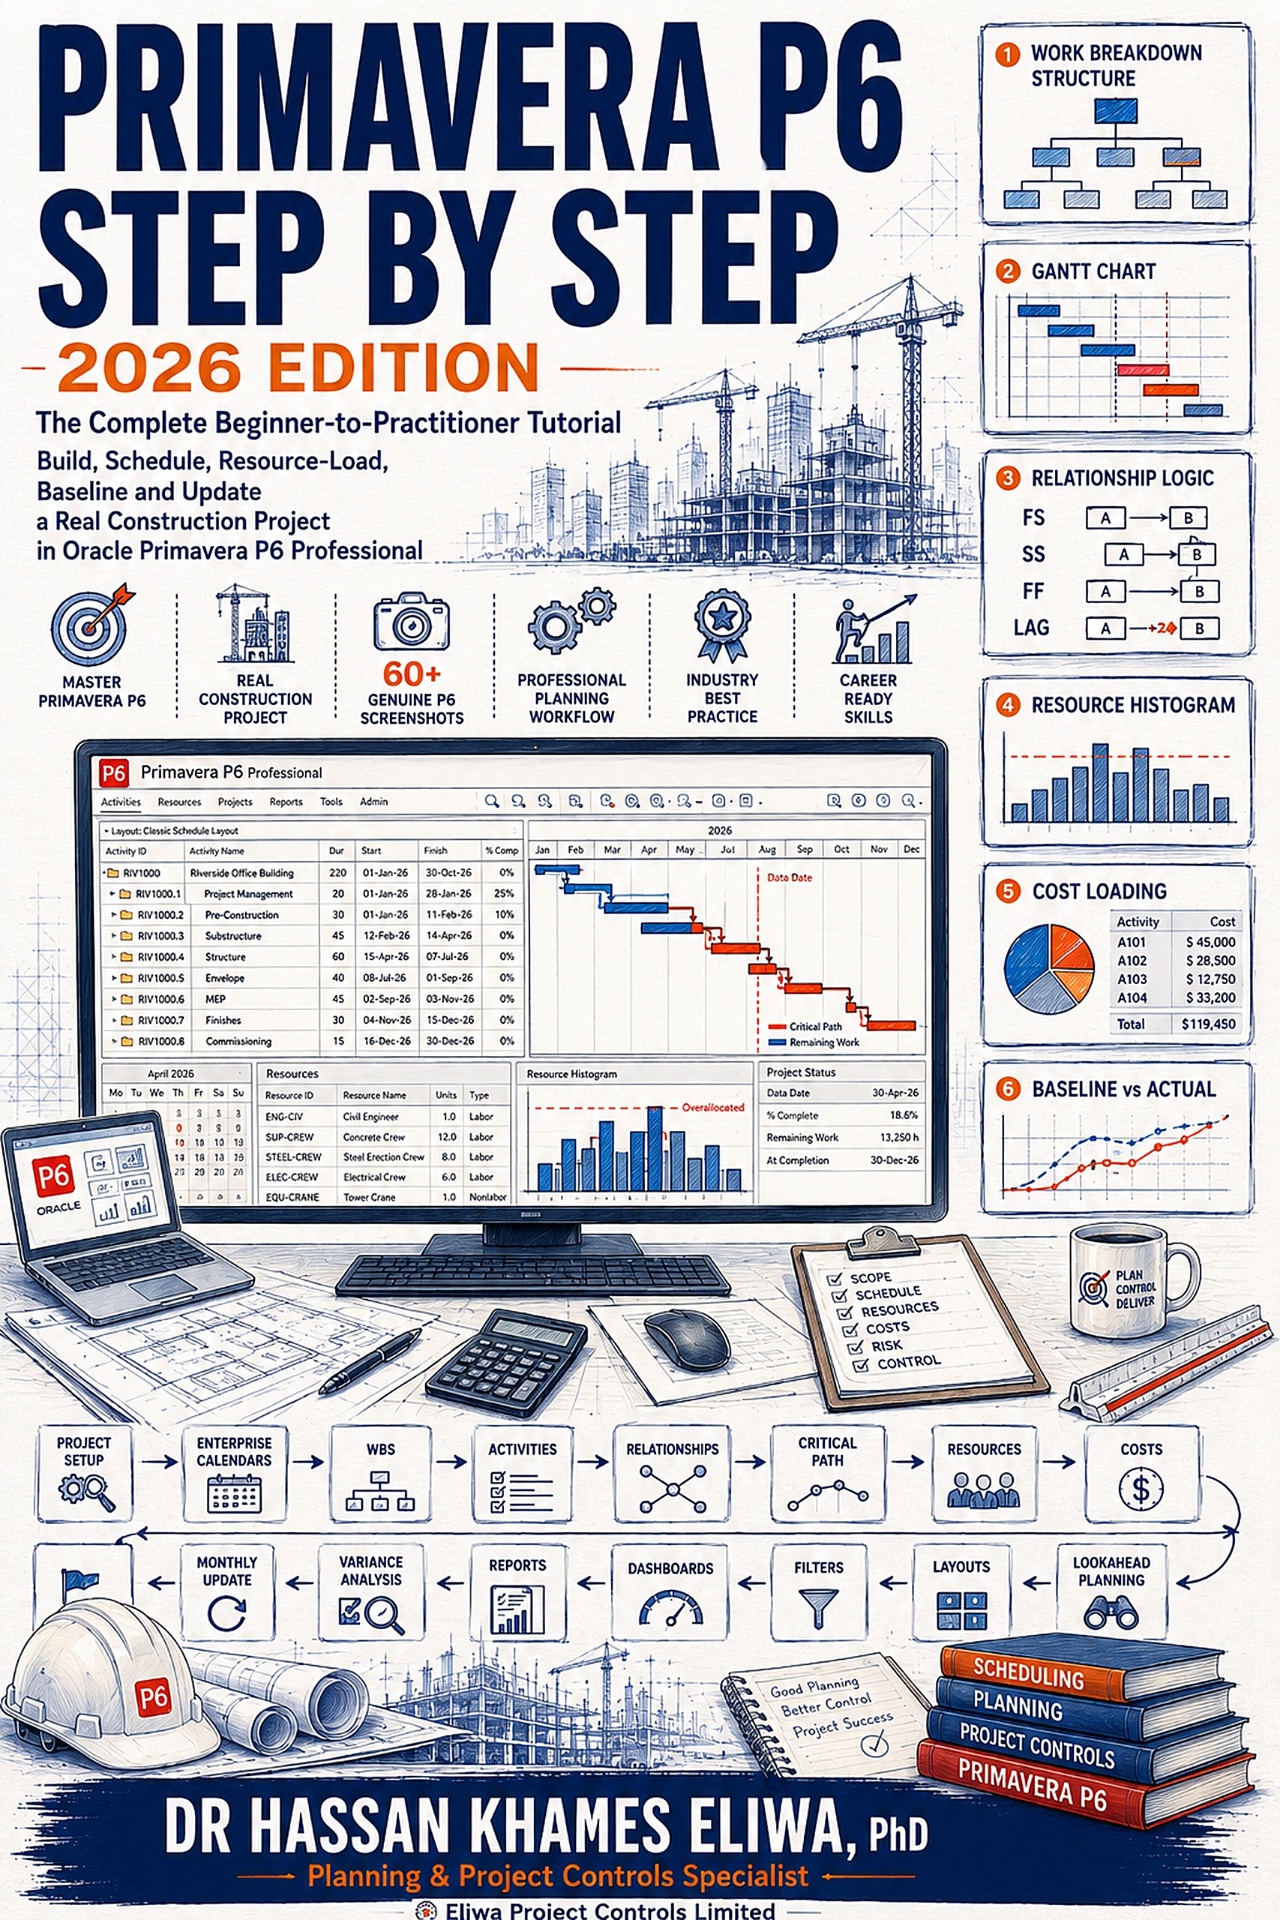
The integrated master schedule (IMS) is the spine of time control on a mega project. It links every contractor's detailed schedule into one logic-driven network, typically in Primavera P6, with common calendars, coding and interface milestones. Without an IMS, each contractor can be 'on schedule' while the programme drifts — because the delays live in the interfaces between them, not inside any single contract.
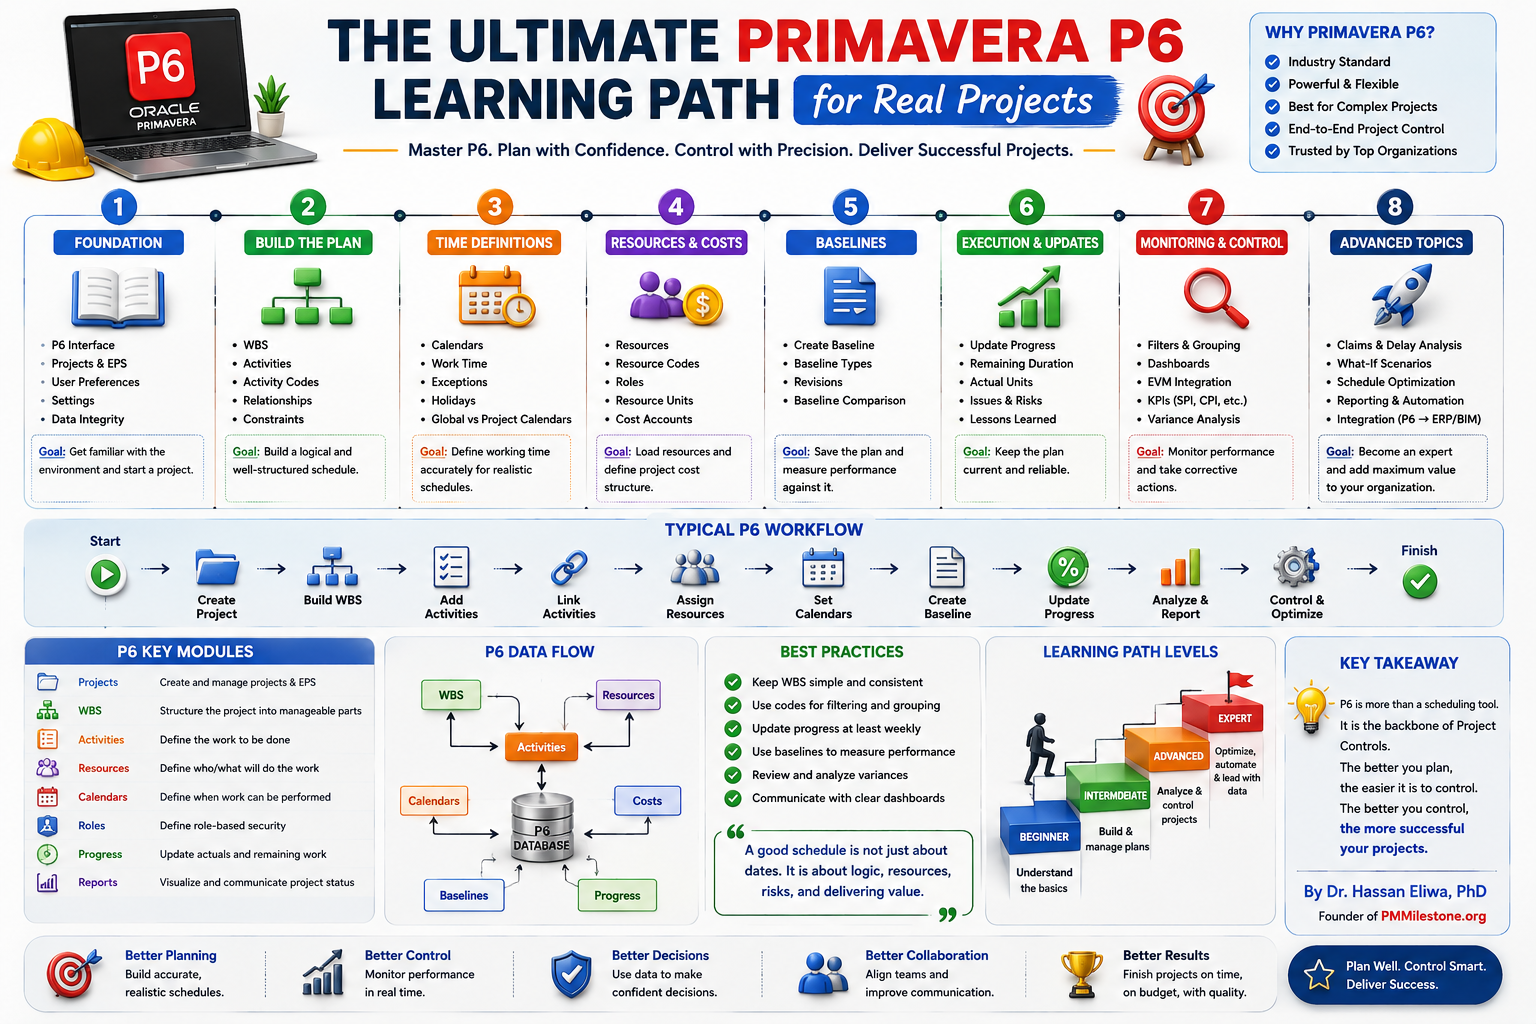
Building and protecting an IMS is a discipline of its own: schedule quality standards (logic density, no dangling activities, constraint discipline), interface milestone registers, float ownership rules and a monthly update cycle with forensic review of changes. The Primavera P6 Learning Path teaches the technical layer; on the analytical side, use the Critical Path Risk Score and the Float Erosion Analyzer to watch the signals that precede slippage.
Layer 4 — Cost control and earned value at scale
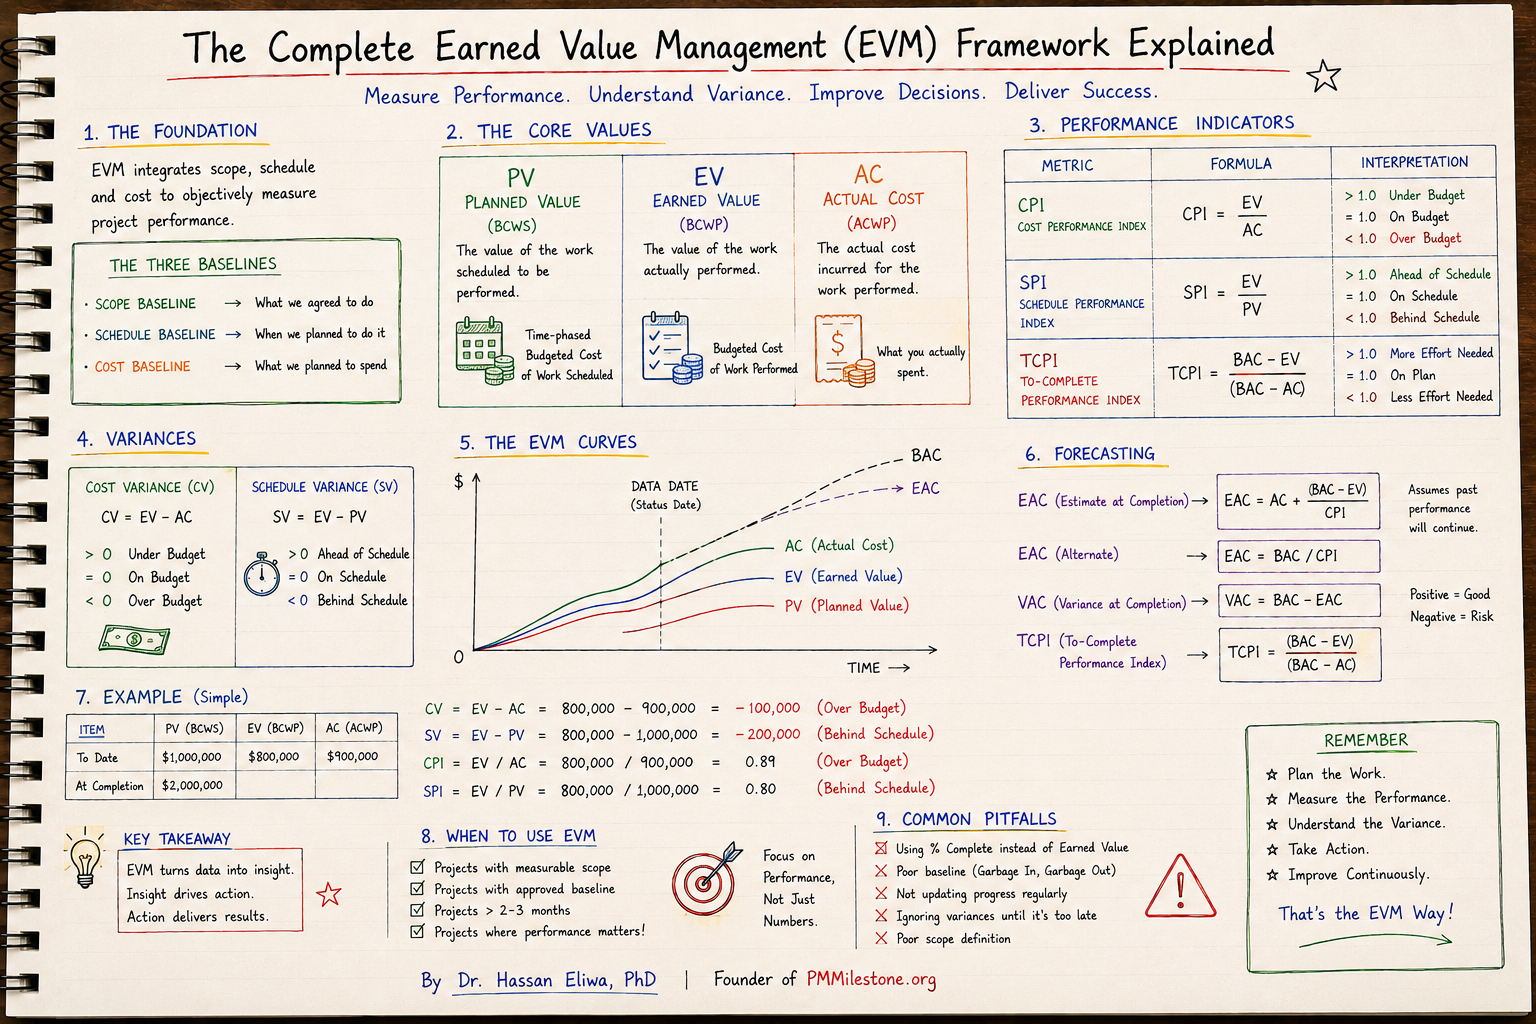
Cost control on a mega project runs on a control budget broken down through the same WBS as the schedule, with commitments, actuals and forecasts tracked per control account. Earned value management is the integrating discipline: it prices physical progress so cost and schedule performance can be read together across every contractor on a common basis.
At scale, the discipline is in the rules, not the formulas. Progress measurement rules must be fixed per package (milestone weighting, units installed, never subjective percent complete), and indices must be reported at control-account level before they are rolled up — a programme-level CPI of 0.98 can hide a tunnelling package running at 0.80. Build fluency with the CPI Calculator, the SPI Calculator and the EAC Calculator, then go deep with the Complete EVM Framework pillar.
| Control level | What is tracked | Decision it supports |
|---|---|---|
| Control account | PV, EV, AC, CPI, SPI per package | Package-level intervention and contractor management |
| Project | EAC range, variance drivers, change log | Forecast confidence and recovery planning |
| Programme | Trend of indices, contingency drawdown | Reserve releases and re-baselining decisions |
| Owner / board | P50/P80 cost and schedule outcomes | Capital planning and stakeholder commitments |
Layer 5 — Risk, contingency and escalation
Mega-project risk management is quantitative and governance-heavy. The register typically carries 300 to 1,500 active risks; the analytical core is Monte Carlo simulation over cost and schedule, producing P50/P80 distributions that drive contingency sizing and owner-level capital planning. Contingency is drawn down against documented events through formal governance — not absorbed silently into package overruns.
Escalation is layered by design: package risks are managed by delivery teams, project-significant risks go to the steering committee, portfolio-significant risks reach the board with defined evidence packages and timelines. The Risk Management on Mega Projects pillar covers the full lifecycle; practise the arithmetic with the Risk Exposure Calculator and the Contingency Reserve Calculator.
Layer 6 — Interfaces, contracts and claims exposure
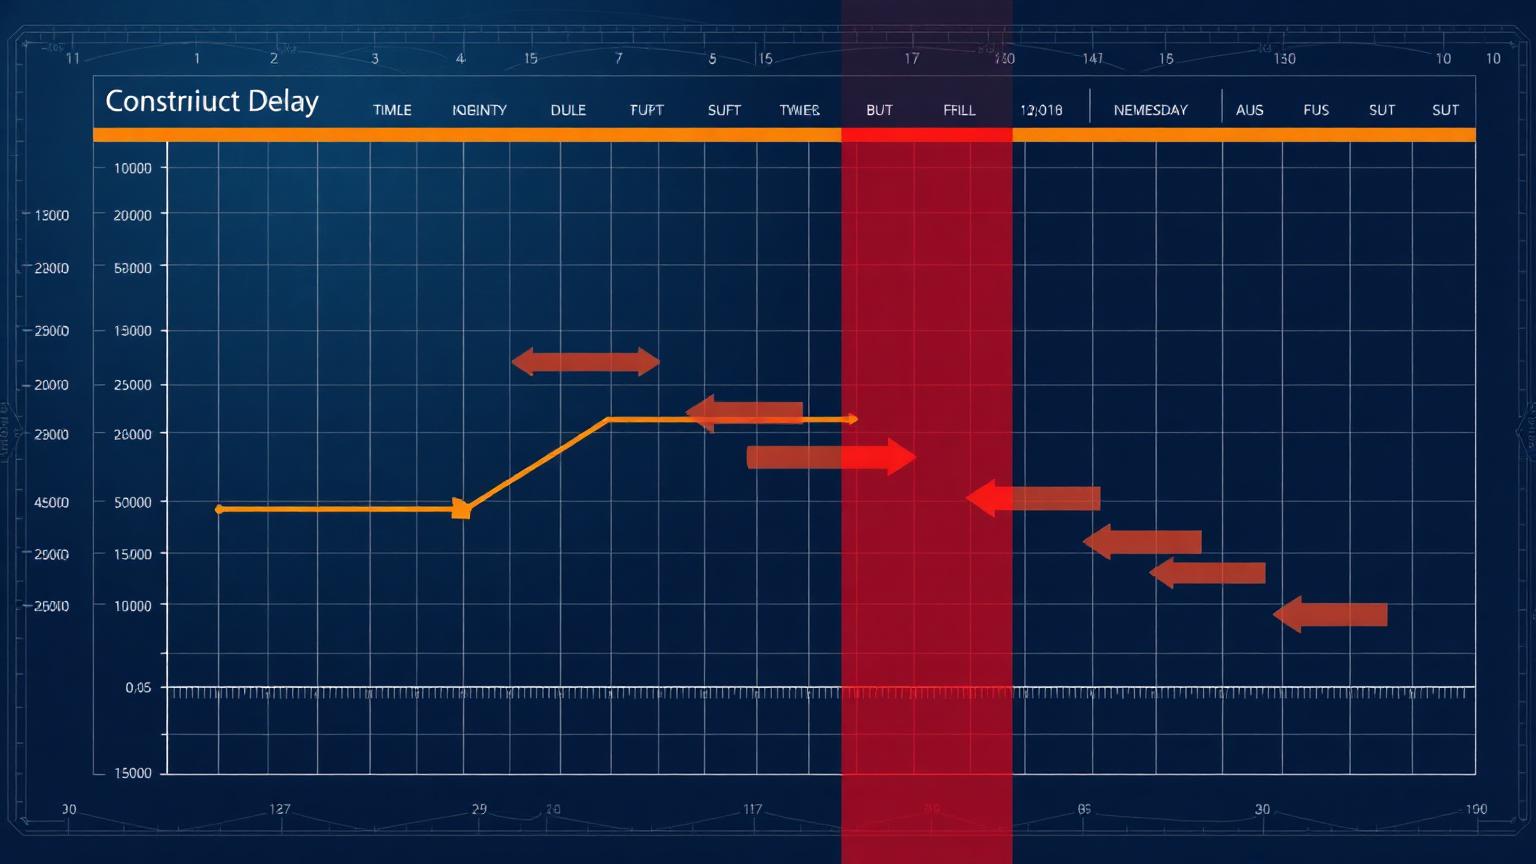
Most mega-project delay does not happen inside contracts; it happens between them. Interface management — the formal registration, ownership and tracking of every handover between contractors, utilities, authorities and the owner — is therefore a first-class control discipline on large infrastructure. Each interface gets an owner, a need date, and a place in the integrated master schedule.
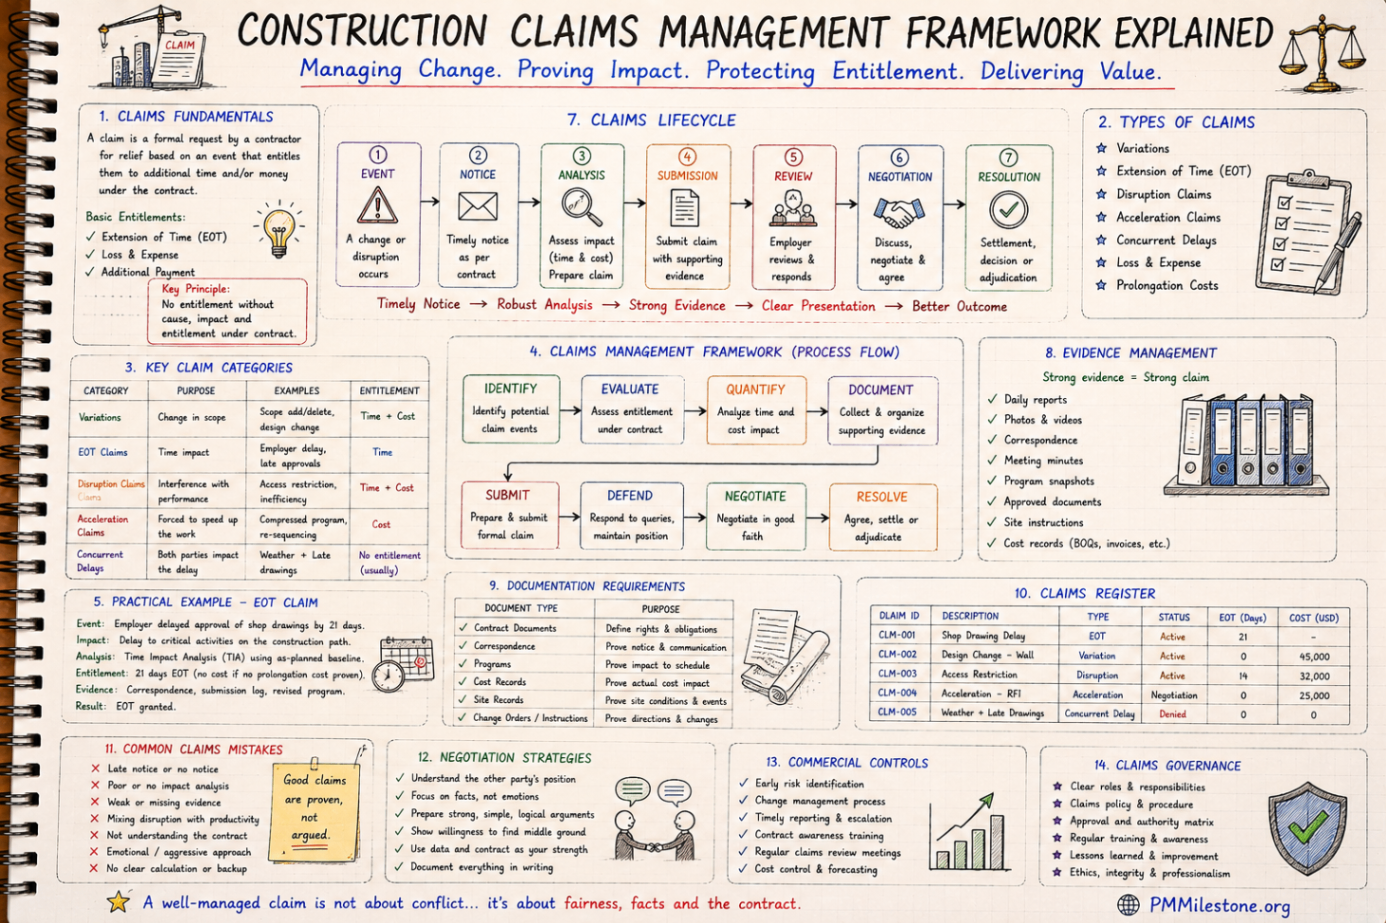
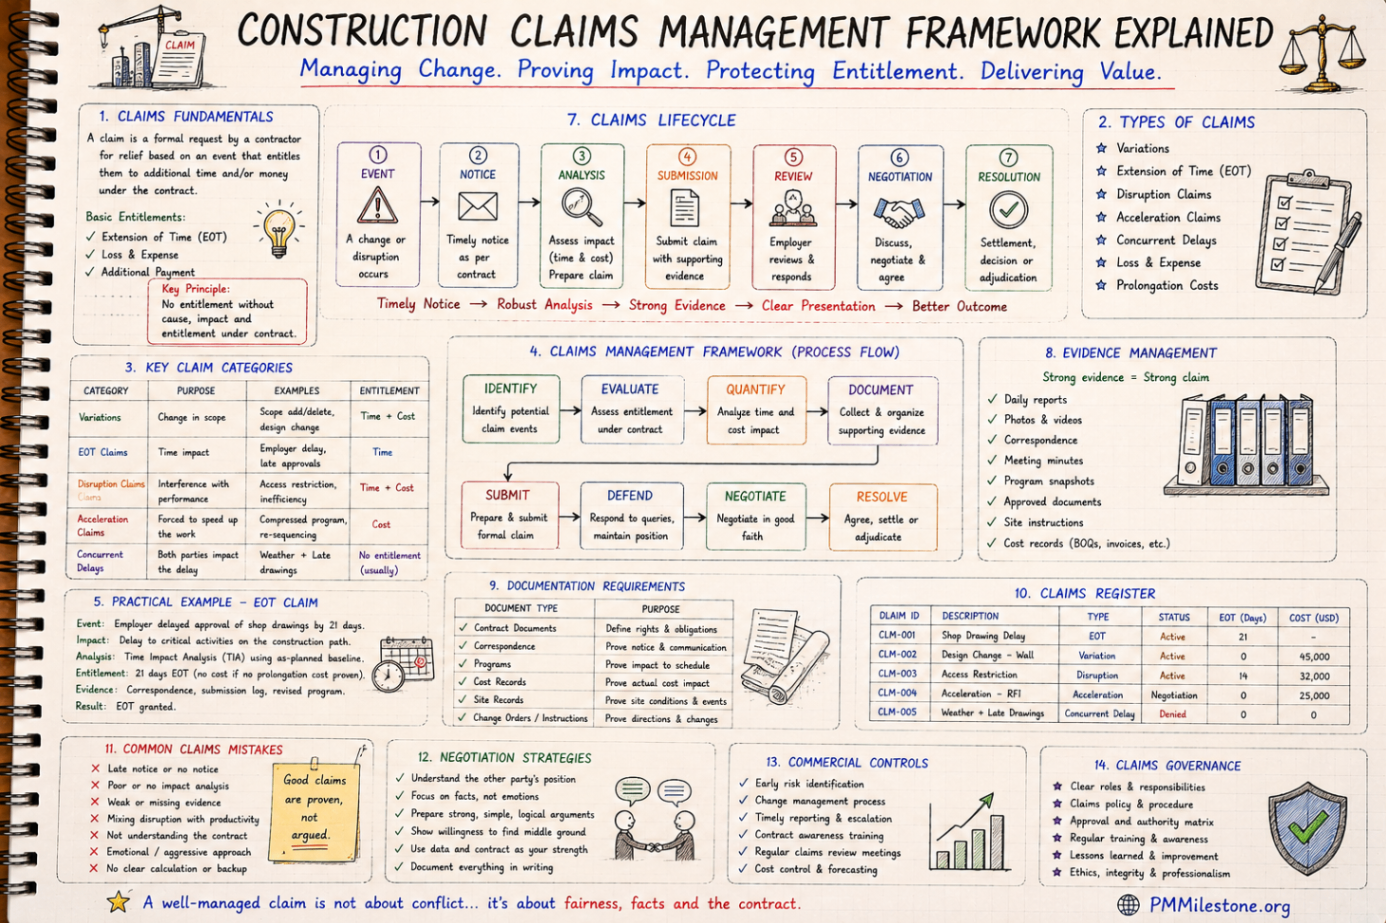
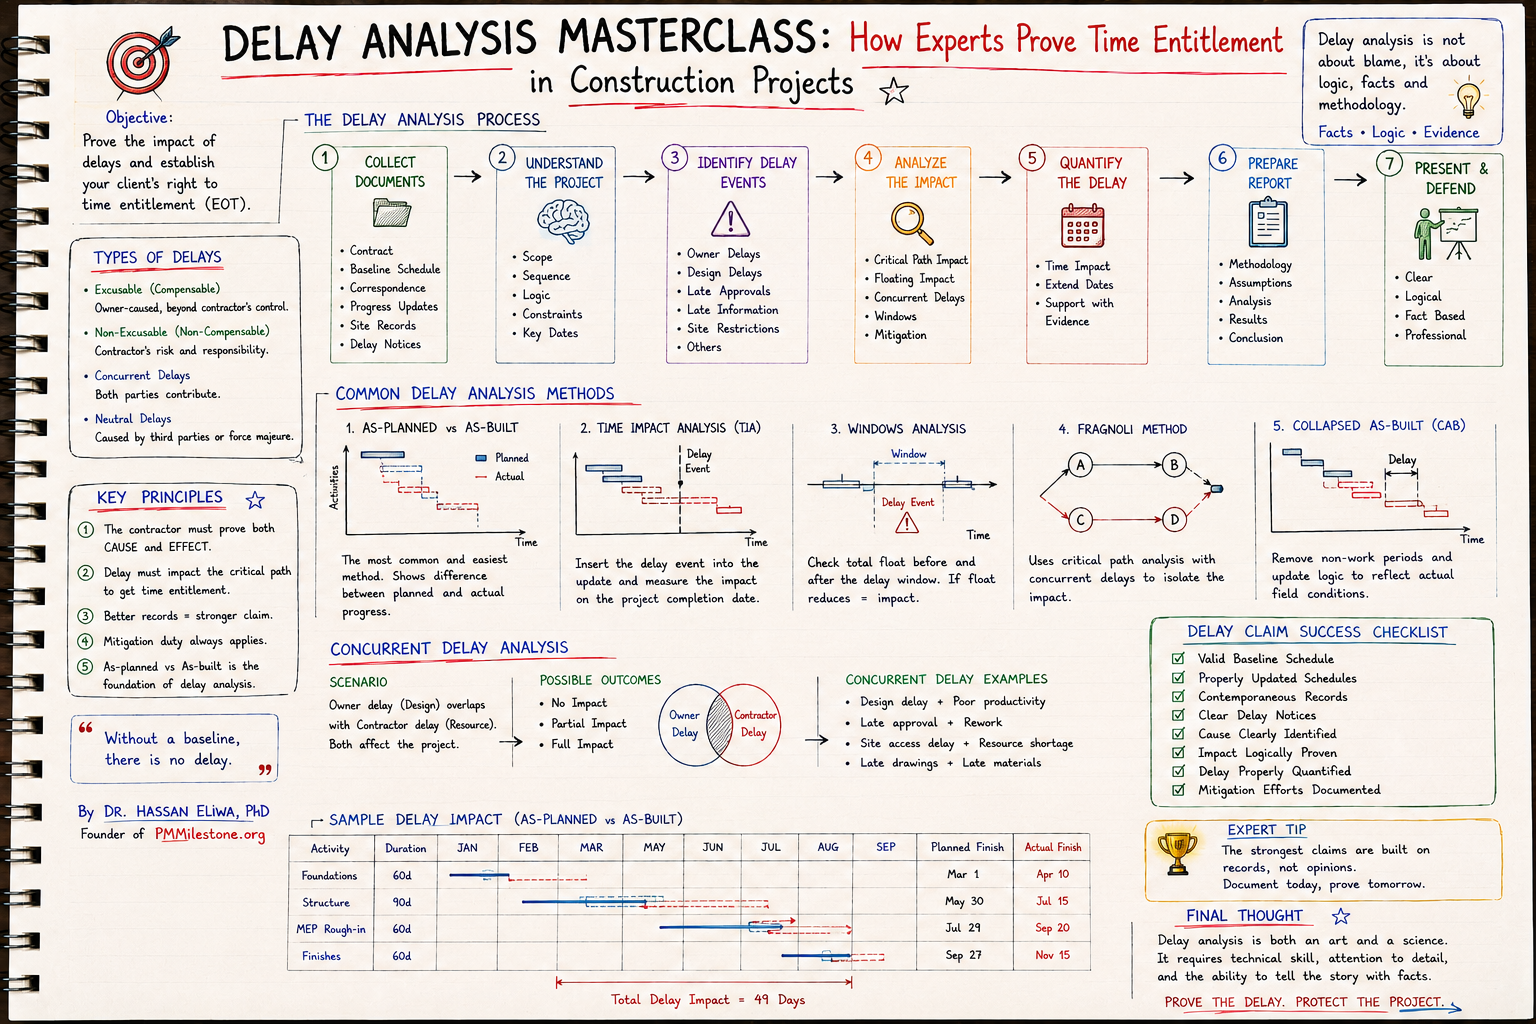
Claims exposure is managed the same way: proactively, through records. Notices served on time, contemporaneous progress evidence, and a schedule history that can support or rebut entitlement years later. The Delay Claims Library shows the recurring claim patterns by cause, and the Delay Analysis Learning Track teaches the forensic methods used when prevention fails.
Layer 7 — Reporting and the digital PMO
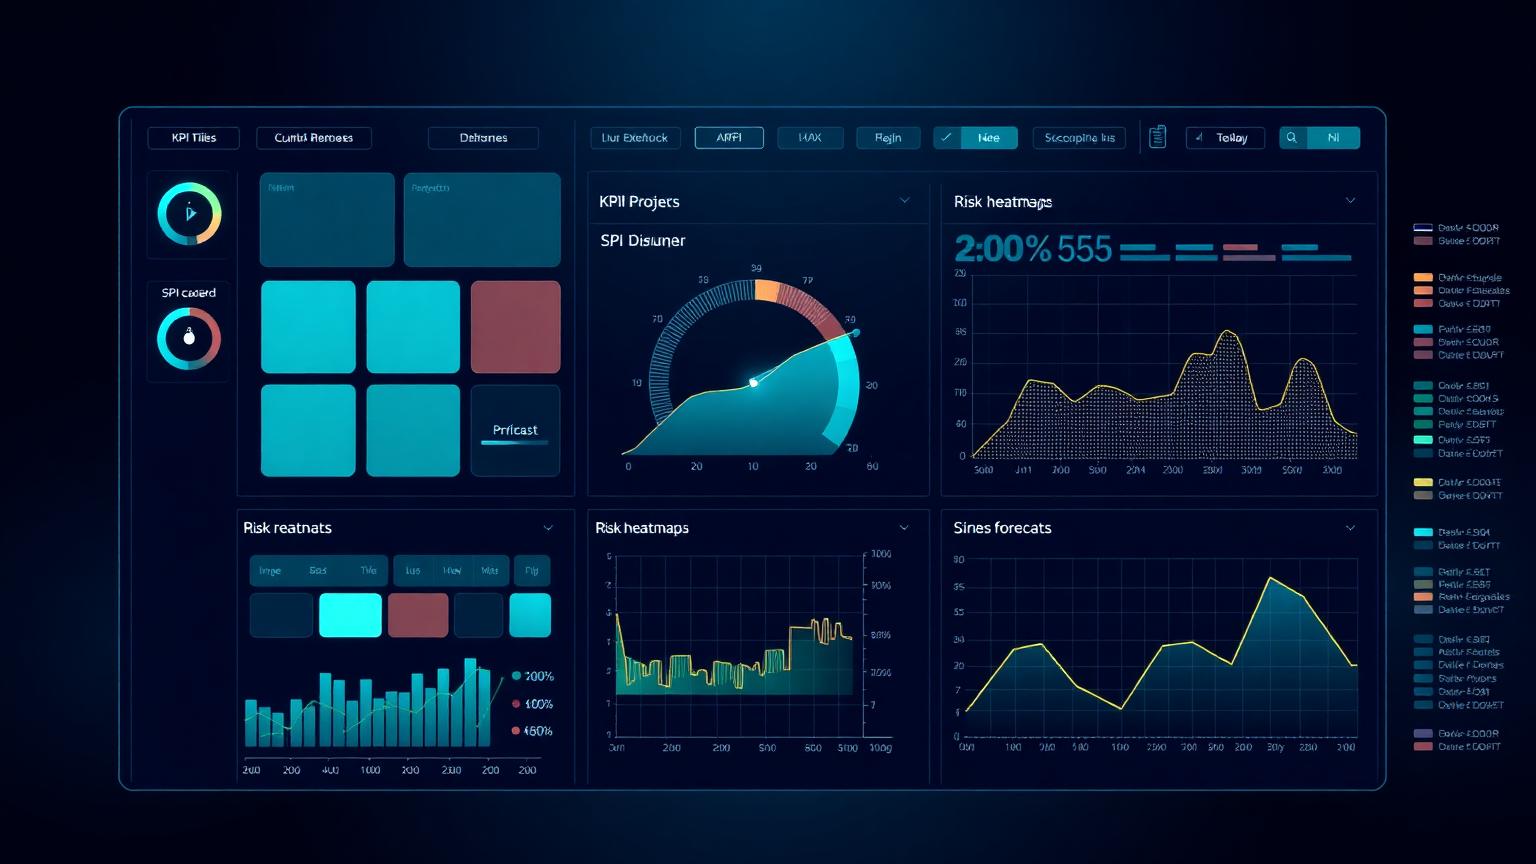
The final layer is the reporting machine: a single source of truth that turns schedule, cost, risk and change data into decisions. On modern programmes this is a digital PMO — a governed data platform where contractor submissions land in standard formats, validation rules catch errors before they reach dashboards, and executives read the same numbers the delivery teams do. The conversation changes from arguing about whose number is right to deciding what to do about it.
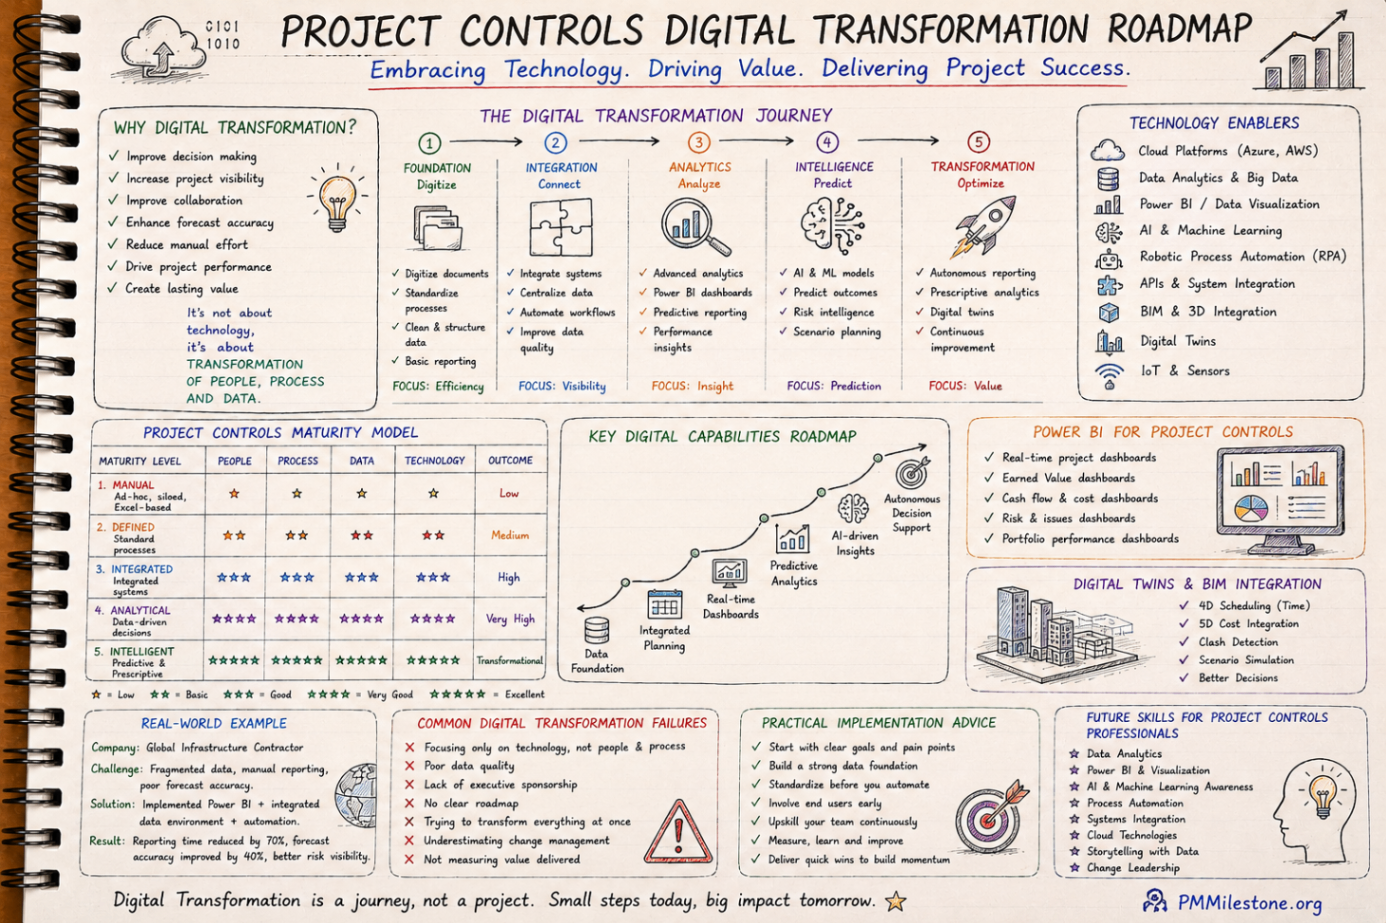
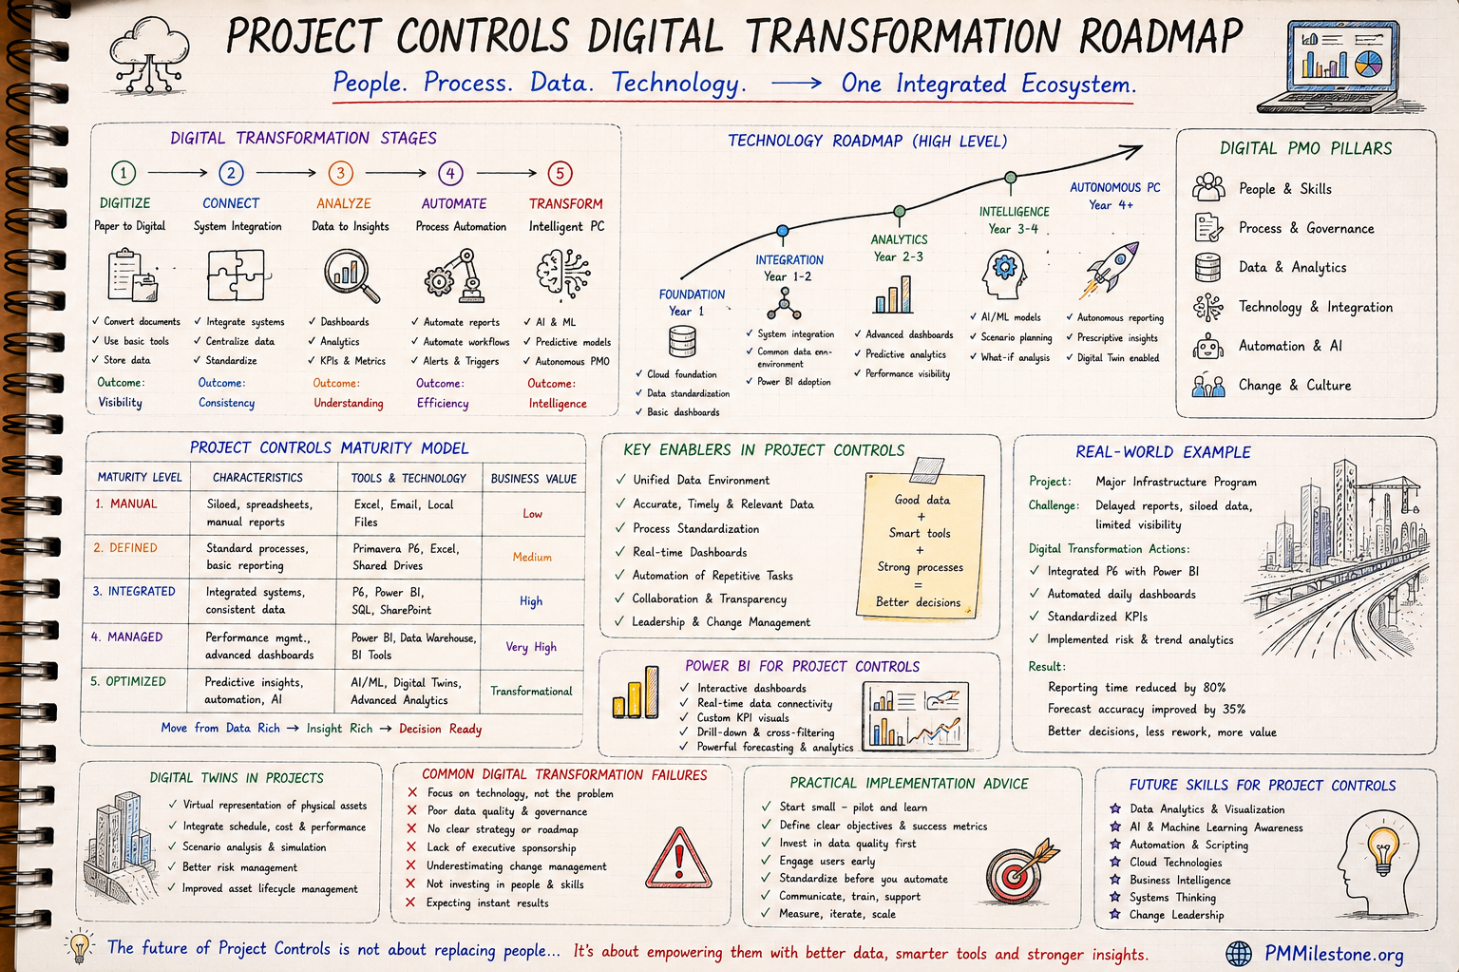
Decision-grade reporting is a design discipline. Executive pages lead with movement since last period, forecast ranges and the decision being requested — not with data density. Study the Dashboard Design Masterclass for the craft, and the Digital Transformation Roadmap for how programmes get from spreadsheet chaos to a governed data platform.
Owner-side versus contractor-side controls
One subtlety that separates experienced mega-project practitioners from textbook readers is the recognition that two control systems run in parallel on every large programme. The contractor controls their own delivery: detailed schedules, crew-level productivity, procurement expediting and margin protection. The owner controls the programme: integrated schedule assurance, independent forecasts, contingency governance and the honest brokerage between what contractors report and what the evidence supports.
These systems are complementary, not duplicative — and the friction between them is healthy when it is structured. Owner teams that simply re-publish contractor numbers add no assurance; owner teams that rebuild everything from scratch add cost without insight. The mature pattern is defined data handovers, independent review of critical-path logic and forecasts, and joint ownership of the interface milestone register. Practitioners who have worked both sides carry a significant advantage into senior roles, because they understand which numbers each side has incentives to shade and which records each side will rely on if the relationship turns commercial.
The staged learning path: how to study this material
The table below sequences the learning path. Each stage pairs a study focus with the PMMilestone resources that teach it and a practical exercise that converts reading into capability. Work through the stages in order — every layer assumes the ones before it.
| Stage | Focus | Study with | Practise by |
|---|---|---|---|
| 1 | Controls fundamentals | Fundamentals pillar, Glossary | Mapping a real project's WBS, baseline and progress rules |
| 2 | Scheduling at scale | P6 Learning Path | Building a two-contractor integrated schedule with interfaces |
| 3 | EVM and forecasting | EVM Framework pillar, calculators | Running CPI/SPI/EAC scenarios on live package data |
| 4 | Risk and contingency | Risk on Mega Projects pillar | Sizing contingency from a quantified register |
| 5 | Governance and reporting | PMO Reporting pillar, Dashboard Masterclass | Drafting a one-page executive report with a decision ask |
| 6 | Failure literacy | Case Studies, Failure Database | Writing a lessons-learned brief on one documented failure |
Lessons from mega projects that lost control
The documented failures share a signature: the control layers existed on paper and were bypassed in practice. Gates passed under schedule pressure. Contractor schedules never truly integrated. Earned value reported at a level too aggregated to see the failing packages. Contingency spent quietly with no governance trail. Reporting that softened bad news until it could no longer be softened. Read the Mega Project Case Studies alongside this track, and the peer-reviewed evidence in the Publications library — pattern recognition across failures is the cheapest experience a controls professional will ever acquire.
The encouraging lesson is the mirror image: programmes that held their gates, protected their baselines, integrated their schedules and reported honestly recovered from serious trouble far more often than the headline statistics suggest. Control systems do not eliminate mega-project risk — they buy the time and evidence needed to act while options still exist. Continue in the PMMilestone Academy with the structured Learning Tracks and Knowledge Pillars to deepen each layer of this path.
Frequently asked questions
What qualifies as a mega project?
The common threshold is total installed cost above one billion dollars, though the control techniques in this path scale down usefully to programmes above roughly $250 million, and to any project with many contractors and complex interfaces.
Why do so many large infrastructure projects overrun despite having controls teams?
Because controls existed on paper but were bypassed in practice: gates that always passed, schedules never truly integrated, earned value reported too aggregated to expose failing packages, and reporting that softened bad news. The discipline of using the system matters more than the system itself.
What is an integrated master schedule and why does it matter so much?
It is the single logic-linked network that joins every contractor's schedule with common calendars, coding and interface milestones. It matters because programme delay usually develops in the handovers between contracts — which no individual contractor schedule can see.
How is earned value different on a mega project compared with a normal project?
The formulas are identical; the discipline is different. Progress measurement rules must be fixed per package, indices analysed at control-account level before rollup, and the EAC presented as a P50/P80 range for owner capital planning rather than a single number.
Where should a practitioner start with this learning path?
In order: fundamentals and terminology, scheduling at scale, EVM and forecasting, risk and contingency, then governance and reporting — finishing with failure case studies. Each layer assumes the ones before it, and the case studies only become instructive once the technical layers are understood.
Where this article connects
Curated cross-links: related Academy articles, the Knowledge Pillars this topic draws on, and the calculators referenced in the FAQs above.
Related Academy articles
Relevant Knowledge Pillars
Calculators referenced in the FAQs
Related learning for this topic
Hand-picked Learning Tracks, Knowledge Pillars, publications and case data that extend this article.
Next steps on PMMilestone
Use these pages to deepen the topic, verify terminology, compare real cases and move from theory into applied project controls practice.
Related calculators
Open the calculators referenced in this article and run them against your own project numbers.
SPI Calculator
Schedule Performance Index — measure schedule efficiency.
Open Earned ValueCPI Calculator
Cost Performance Index — measure cost efficiency.
Open ForecastingEAC Forecast Calculator
Estimate at Completion — forecast final project cost.
Open ScheduleCritical Path Risk Score
Score the fragility of your critical path.
Open RiskContingency Reserve Calculator
Calculate a risk-weighted contingency reserve.
Open RiskRisk Exposure Calculator
Quantify Expected Monetary Value of a risk.
OpenOther learning tracks
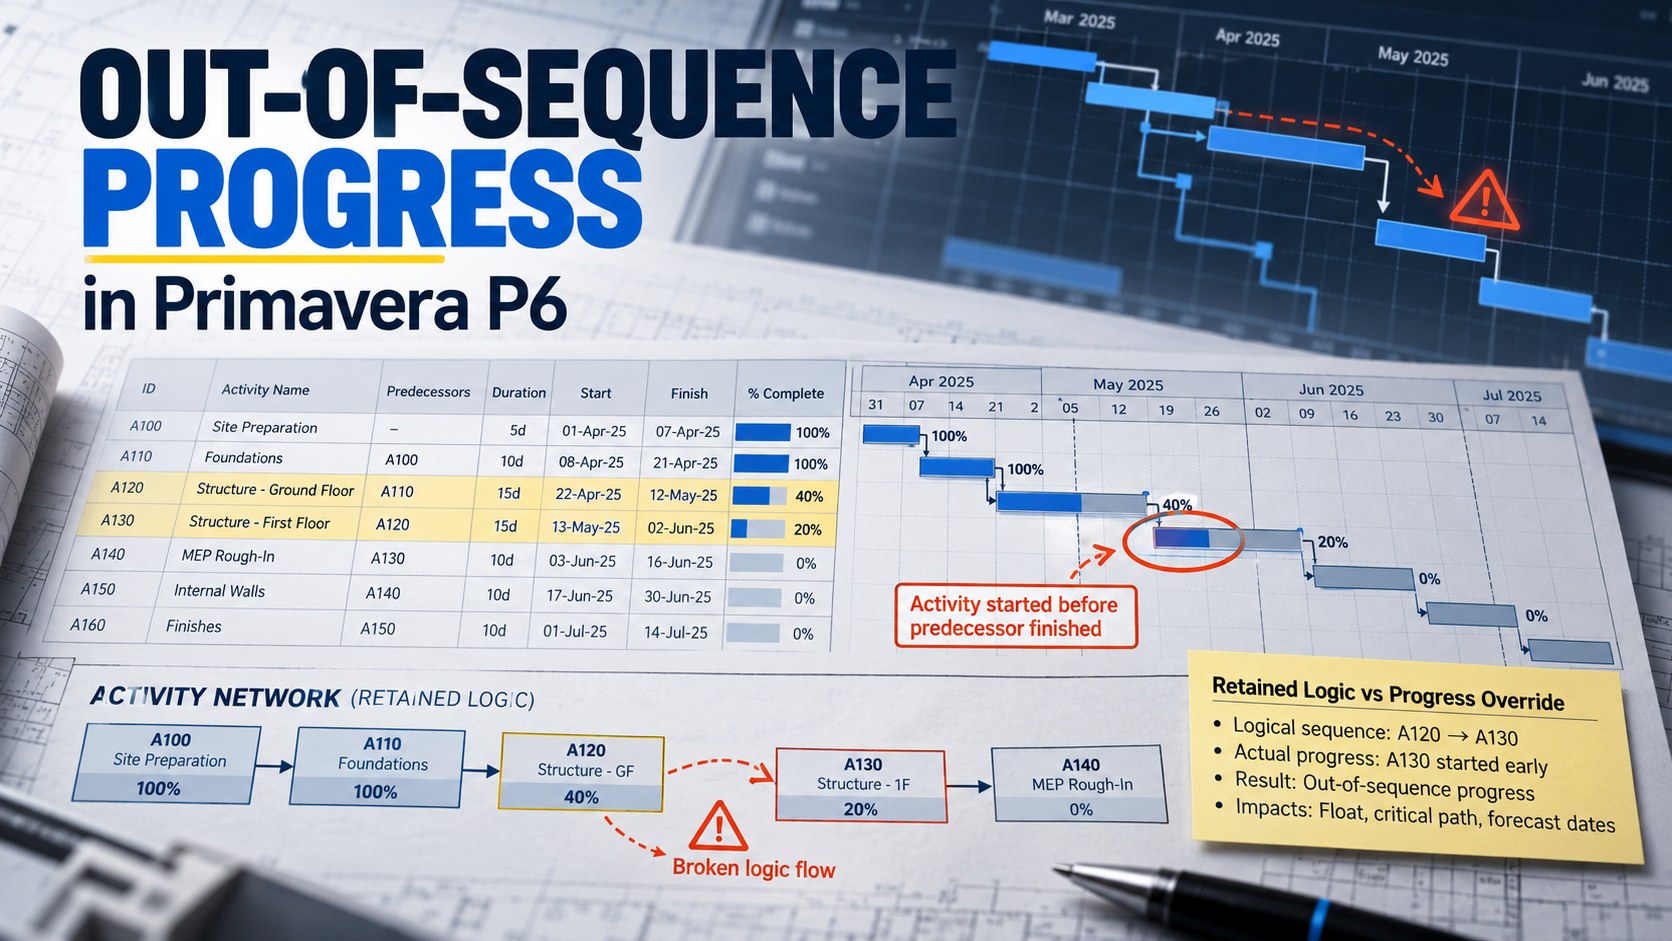
How to Fix Out-of-Sequence Activities in Primavera P6 Before They Distort Your Critical Path
Repair out-of-sequence progress with a five-step workflow, a DN600 pipeline example, scheduling-option comparisons and a monthly evidence checklist.
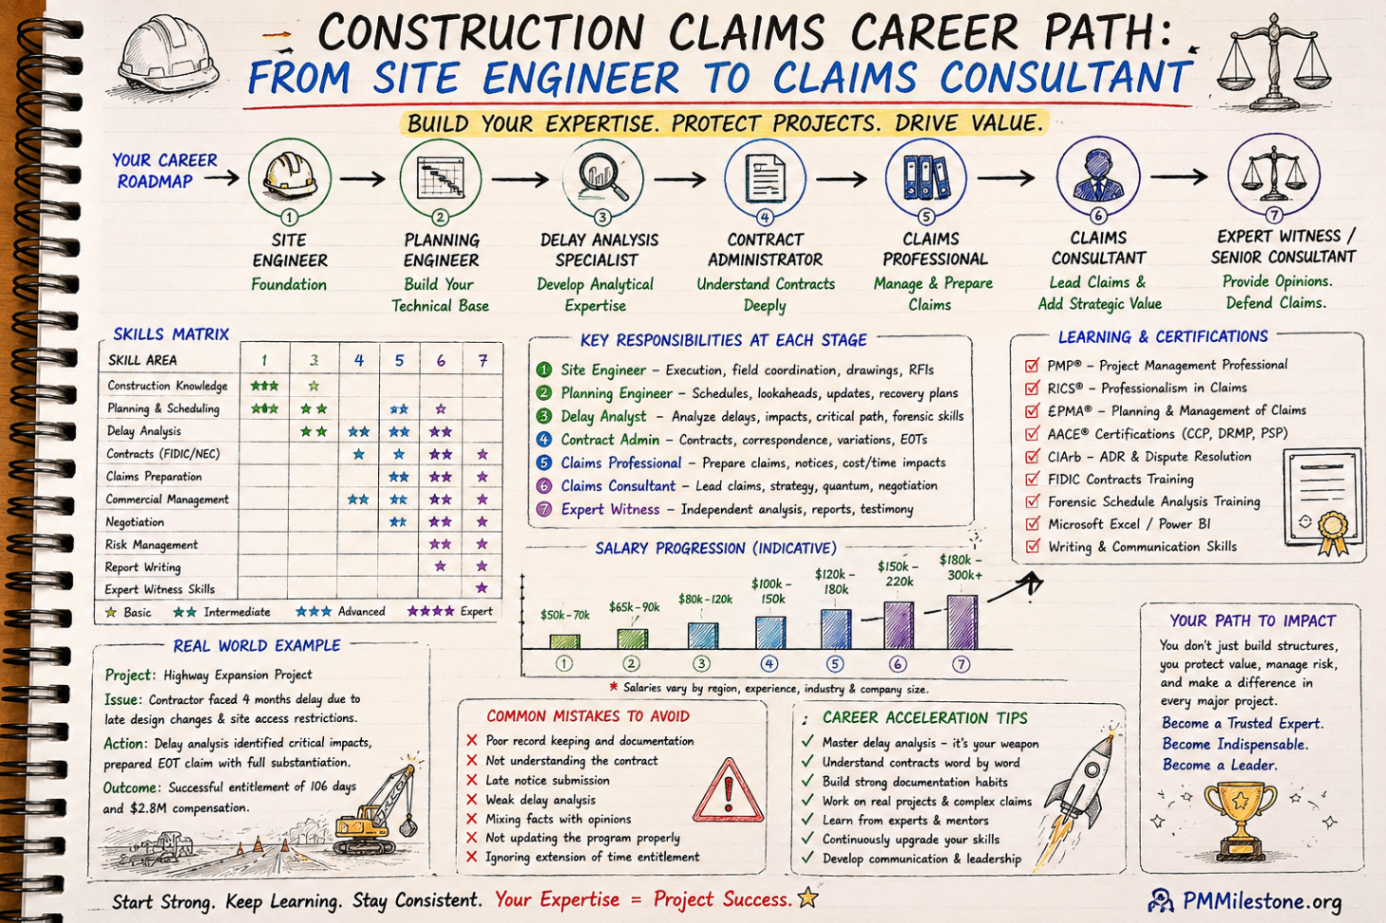
Construction Claims Career Path
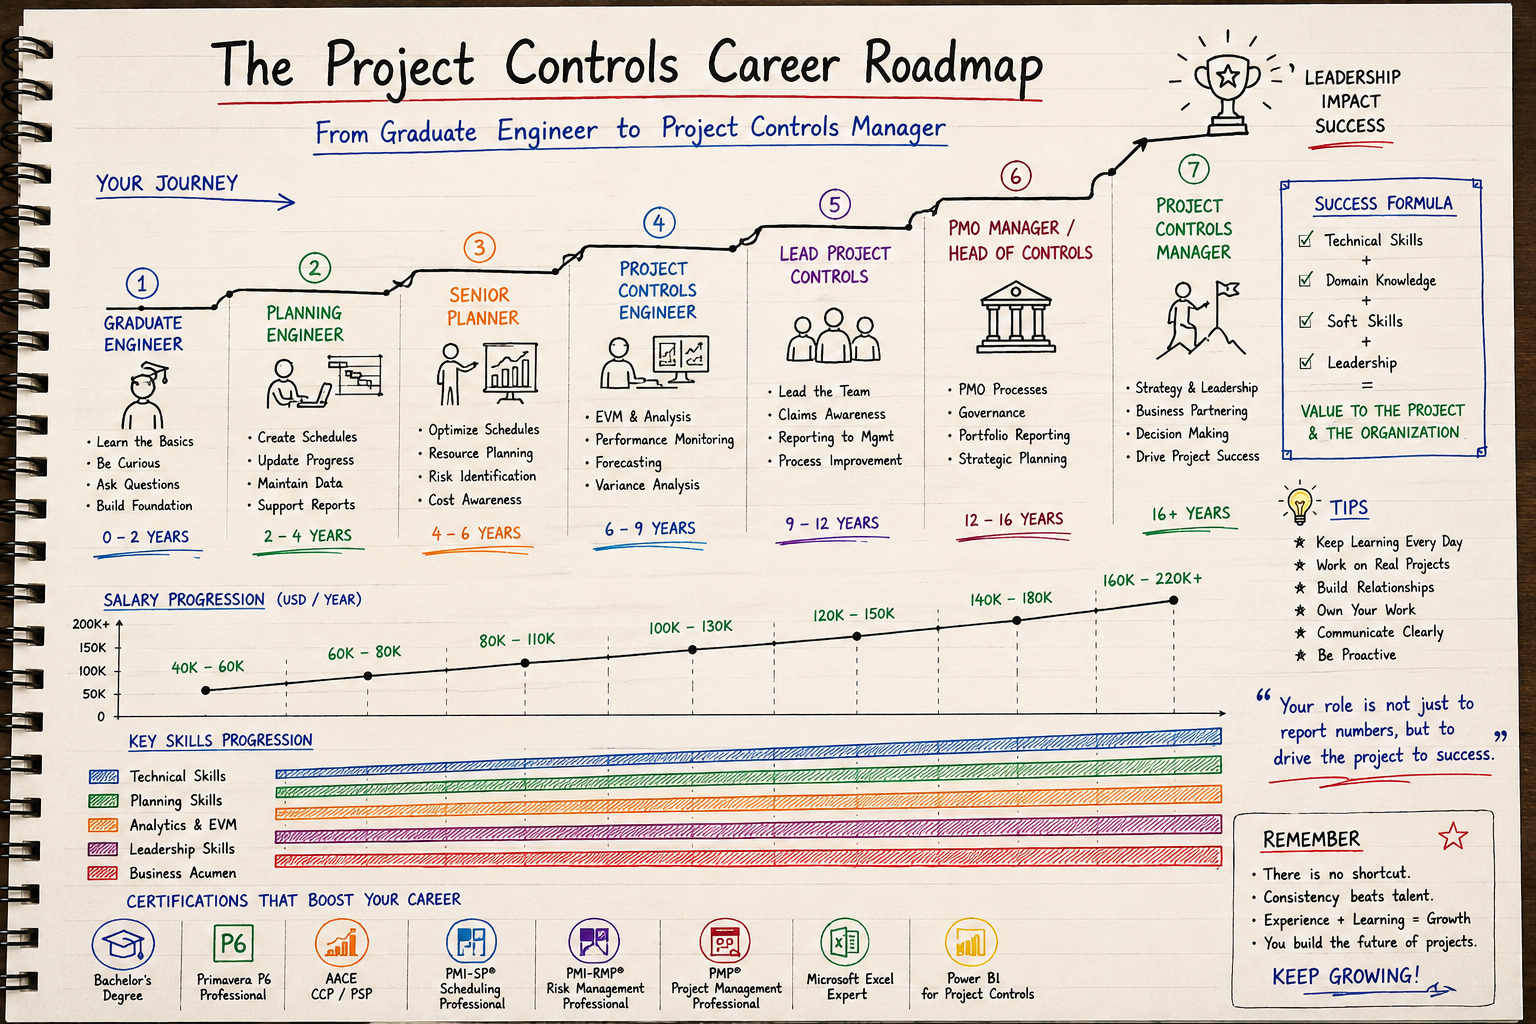
A practical roadmap for engineers moving from site delivery into planning, delay analysis, claims, commercial controls and senior claims consulting.
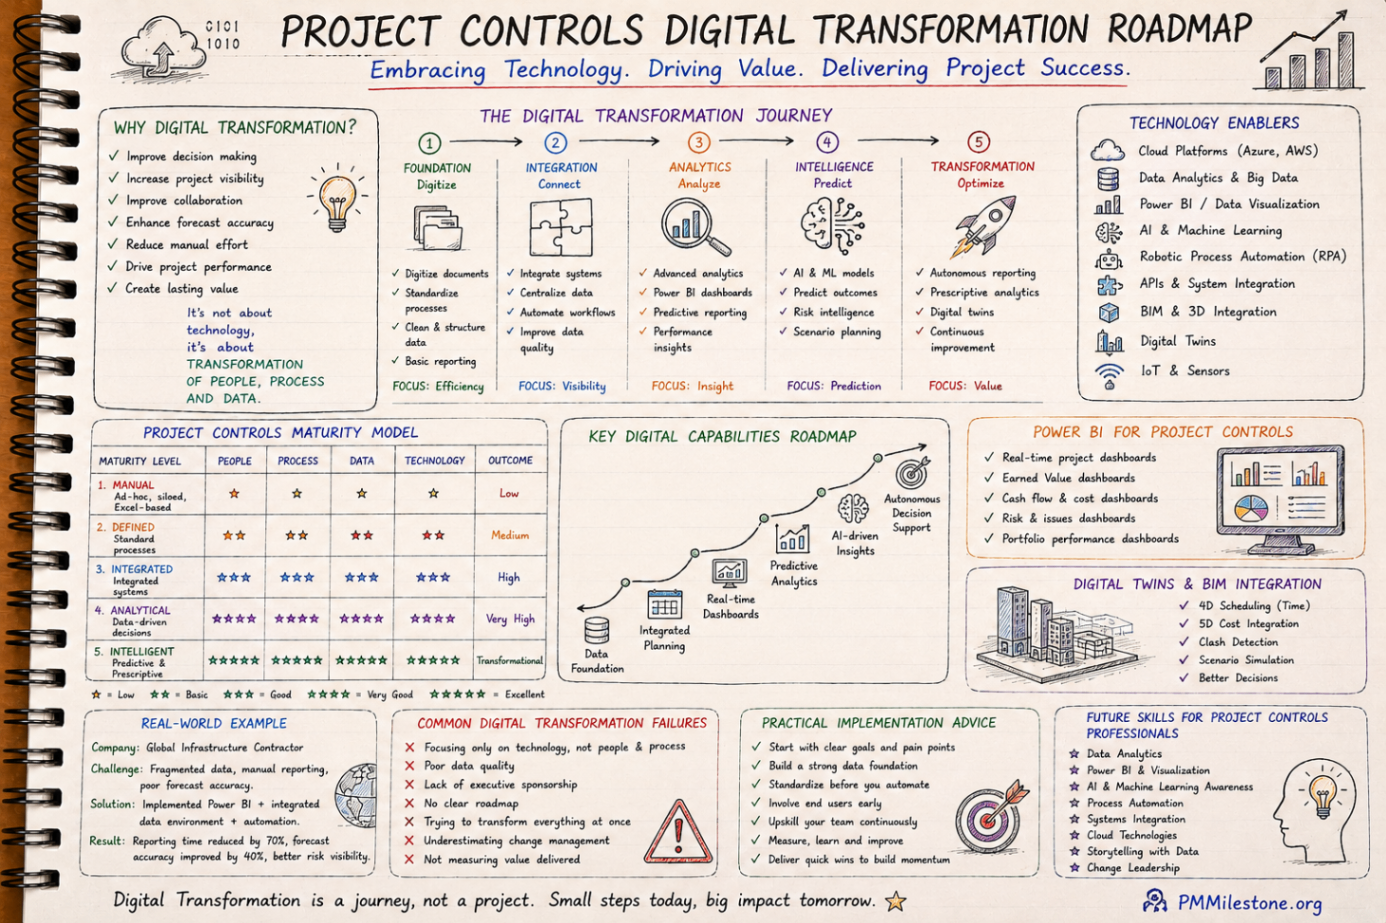
Project Controls Digital Transformation Roadmap
A future-focused guide to modern project controls through data integration, reporting automation, Power BI, AI, BIM and digital PMO capability building.