Time Impact Analysis vs Windows Analysis: How to Choose the Right Delay Method — and Defend It
A practitioner's guide to forensic delay methods, concurrency under the SCL Protocol, and the evidence that turns an analysis into an entitlement.

The first delay claim I ever ran was technically flawless and commercially useless. Fourteen hundred pages, a beautifully impacted network, activity IDs cross-referenced to a lever-arch file of daily records. The engineer read the covering letter, turned to the programme appendix, found that our baseline had eleven open ends and four constraints holding the finish date, and rejected the whole submission in a page and a half. He never argued with the analysis. He never had to.
That is the thing most delay training gets backwards. The choice between time impact analysis and windows analysis is not really a technical choice — it is an evidential one. Both methods are legitimate. Both appear in the Society of Construction Law Delay and Disruption Protocol. Both have been accepted and rejected by tribunals depending on the facts in front of them. What separates a claim that gets paid from one that gets returned is whether the method you picked fits the records you actually hold, and whether you can explain in three sentences why you picked it.
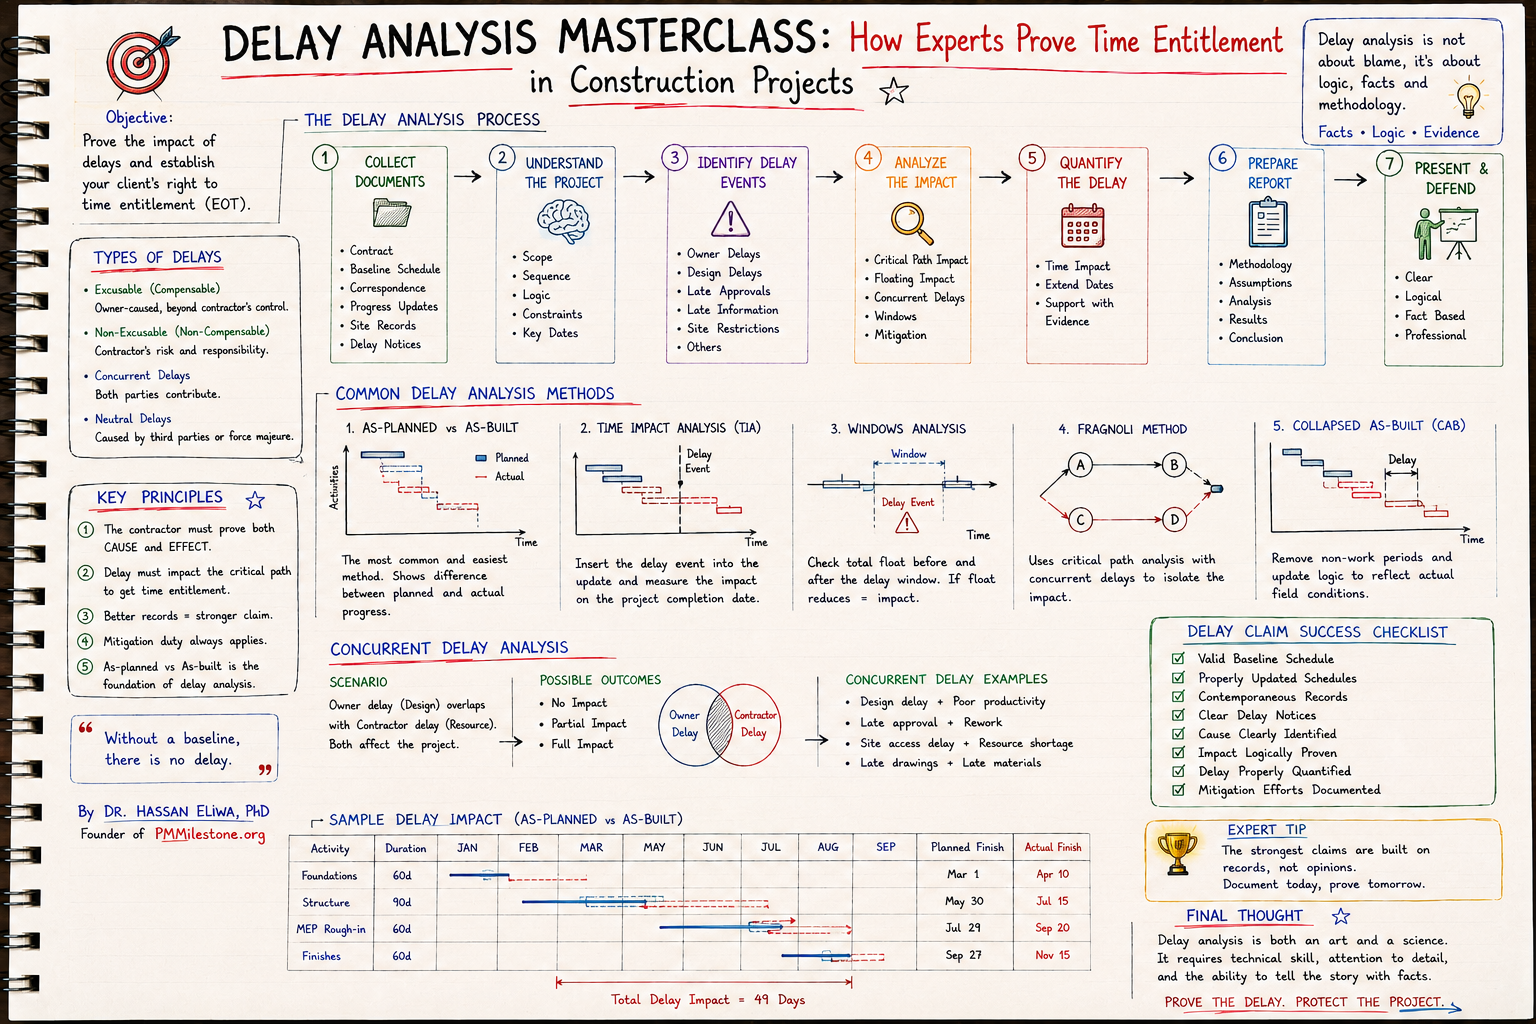
This article walks through that decision the way it happens on a live job: what each method actually does to the network, how the same set of facts produces different answers, how concurrency gets treated once the analysis is done, and the sequence of steps that turns the whole thing into a submission an assessor can approve without reputational risk. For the broader forensic playbook, see the delay analysis knowledge pillar and the delay claims library.
What the two methods actually do
Time Impact Analysis — modelling the delay as it happened
Time impact analysis (TIA) is prospective in character. You take the accepted programme updated to just before the delay event, insert a sub-network or fragnet representing the event, recalculate, and read the movement of the completion date. The answer you get is the delay the event would have caused given what was known at that moment. It is the method embedded in NEC compensation event assessment, where the whole contractual philosophy is to price and programme change as it arises rather than argue about it at the end.
Its strength is causation. Because you model one event against one dated update, the link between cause and effect is explicit and easy for a non-planner to follow. Its weakness is that it is a model of what should have happened, not a record of what did. Run twelve TIAs on a job that overran by twenty weeks and the sum will rarely equal twenty. Sequences change, resources move, activities that were never critical become critical. The further you get from the event date, the more the model and the site diverge.
Windows analysis — measuring what the programme actually recorded
Windows analysis is retrospective. You divide the project into periods — usually bounded by programme updates, monthly reporting cycles, or major events — and at each window boundary you compare the forecast completion date at the start against the forecast at the end. The movement in that window is the delay that accrued in that window. You then examine the records for that period to establish what caused it.
Its strength is that it measures the real critical path as it migrated through the job, which is exactly what tribunals want to see. Its weakness is appetite: it needs a credible baseline, a genuine series of updates, and enough contemporaneous records to attribute each window's movement to a cause. On a project where the programme was updated twice in three years and the second update was reconstructed from memory, windows analysis has nothing to stand on.
| Dimension | Time Impact Analysis | Windows Analysis |
|---|---|---|
| Direction | Prospective — models effect at the time of the event | Retrospective — measures effect after the period closed |
| Primary input | Programme update immediately before the event + fragnet | Series of programme updates across the whole duration |
| Question answered | What delay would this event have caused? | What delay actually accrued, and why? |
| Critical path treatment | Single path, fixed at the update date | Migrating path, re-tested at every window |
| Handles concurrency | Poorly in isolation — needs a separate test | Well — competing causes visible within the window |
| Typical effort | Low to medium per event | High — scales with number of windows |
| Best contractual fit | NEC3/NEC4 compensation events; live EOT applications | FIDIC and bespoke forms; retrospective / final account claims |
| Common failure mode | Sum of events exceeds actual overrun | Windows too wide, causes blur together |
An as-planned vs as-built delay analysis example
Method arguments stay abstract until you put numbers on them, so take a wastewater pump station upgrade — a genuinely ordinary job, the kind that fills most of our working lives. Contract duration forty-three weeks. Actual duration fifty-three weeks. Ten weeks of overrun, liquidated damages running at a level that made the ten weeks the single largest commercial item on the project.
Three events were in play. Latent ground conditions discovered during bulk excavation, which turned a five-week dig into nine. Late issue of IFC drawings for the valve chamber pipework. And a switchgear delivery that slipped because the supplier's factory acceptance test failed twice. Alongside those sat two contractor problems nobody was pretending otherwise about: a piling rig breakdown and an under-resourced M&E subcontractor.
The as-planned versus as-built comparison is the first thing to build, and it is worth being clear about what it is and is not. It is an observational technique. It shows you where time was lost, in what quantity, on which activities. It does not, by itself, establish causation or criticality — bulk excavation slipping four weeks means nothing unless bulk excavation was driving the completion date at the time it slipped.
What the picture does deliver, immediately and cheaply, is a set of questions. Why did wet well walls start six weeks late when the base pour only slipped two? Why did M&E take nine weeks against a planned eight, when the resource histogram showed the same crew? Those questions are where the analysis actually begins.
| Activity | Baseline dur. | As-built dur. | Finish slip | Critical at the time? | Attributed cause |
|---|---|---|---|---|---|
| Bulk excavation | 5 wk | 9 wk | +4 wk | Yes | Latent ground (Employer) |
| Piling | 6 wk | 7 wk | +5 wk | Yes | Rig breakdown (Contractor) |
| Wet well base pour | 3 wk | 4 wk | +6 wk | Yes | Knock-on from above |
| Wet well walls | 6 wk | 7 wk | +7 wk | Yes | Knock-on + winter pour |
| Pipework & valves | 7 wk | 8 wk | +8 wk | Yes | Late IFC drawings (Employer) |
| M&E installation | 8 wk | 9 wk | +9 wk | Yes | Resourcing (Contractor) + switchgear |
| Commissioning | 4 wk | 5 wk | +10 wk | Yes | Switchgear FAT failure (Employer) |
Applying windows analysis to the same facts
With a monthly update cycle available, the pump station was a natural windows job. We cut five windows at the update dates and asked one question at each boundary: how far did the forecast completion date move, and what was driving the longest path when it moved?
The picture that emerges is quite different from the bar chart. Ten weeks of overrun did not accrue smoothly. Four weeks landed in Window 1 from the ground conditions. Window 2 actually recovered a week through resequencing. Window 3 produced three weeks of excusable delay plus two weeks where the late IFC drawings and the contractor's own procurement lag were both, on the evidence, critical at the same time. Window 4 split evenly between employer and contractor causes. Window 5 was contractor culpable, partly offset by two weeks of genuine acceleration.
| Window | Period | Drift | Driving path at window close | Liability finding |
|---|---|---|---|---|
| W1 | wk 0–12 | +4 wk | Bulk excavation → piling | Excusable & compensable |
| W2 | wk 12–23 | −0 wk | Base pour → walls | Net nil (1 wk culpable, 1 wk recovered) |
| W3 | wk 23–34 | +5 wk | Pipework → M&E | 3 wk excusable, 2 wk concurrent |
| W4 | wk 34–45 | +4 wk | M&E installation | 2 wk excusable, 2 wk culpable |
| W5 | wk 45–53 | −1 wk | Commissioning | 1 wk culpable, 2 wk acceleration credit |
| Total | wk 0–53 | +10 wk | — | 9 wk EOT / 3 wk culpable / 2 wk recovered |
Two features of that result deserve attention. First, the windows exercise found time the as-built chart could not see — a week of recovery in Window 2 that the contractor had achieved and then quietly lost credit for. Second, it isolated Window 3 as the only genuinely contested period. That is enormously valuable commercially. Rather than negotiating ten weeks across a whole project, the parties ended up arguing about two weeks in one window, and the settlement conversation took an afternoon instead of a quarter.
Concurrent delay and the SCL Protocol
Window 3 is where the pump station claim earned its keep, because it contained genuine concurrency. The IFC drawings for the valve chamber arrived nineteen days late. In the same period, the contractor's valve order had not been placed on time and would have arrived late regardless. Both events sat on the critical path. Both, independently, would have delayed completion.
- 1. Two or more effective causes of delay in the same period?✓ Yes → Continue✗ No → → Not concurrent. Sequential or single-cause.
- 2. Each event independently critical (would delay completion on its own)?✓ Yes → Continue✗ No → → Not concurrent. The non-critical event has no time effect.
- 3. Approximately equal causative potency?✓ Yes → Continue✗ No → → Not concurrent. Dominant-cause analysis applies.
- 4. One event only became critical after the other consumed the float?✓ Yes → Sequential — not concurrent.✗ No → → True concurrency: time yes, prolongation money no (per SCL).
The SCL Protocol's position, restated in the second edition, is narrower than the way the phrase gets used on site. True concurrency requires two or more effective causes of delay, of approximately equal causative potency, each independently critical, operating over the same period. If one event only becomes critical because the other has already consumed the float, the events are sequential, not concurrent. If one is plainly the dominant cause, the Protocol expects you to say so rather than reach for concurrency as a compromise.
Where true concurrency is established, the Protocol separates time from money. The contractor is entitled to an extension of time, because the employer risk event did in fact prevent completion by the contract date and the employer should not benefit from its own delay by levying damages. But the contractor is not entitled to prolongation cost for that period, because it would have incurred those costs anyway as a result of its own delay. Time yes, money no — and that split is the single most useful thing to understand before walking into a negotiation.
| Scenario | Time entitlement (EOT) | Prolongation cost | Practical note |
|---|---|---|---|
| Employer risk event alone drives the critical path | Full EOT | Recoverable | The straightforward case; still needs notice compliance |
| Contractor risk event alone drives the critical path | None | None | Exposure to LDs for the full period |
| True concurrency — both independently critical | Full EOT | Not recoverable | The core SCL position: time without money |
| Employer event on a path with float; no completion impact | None | Disruption may still apply | Float belongs to the project, not to either party |
| Contractor already in culpable delay when employer event hits | Fact-dependent | Usually not recoverable | Check the contract; some forms address this expressly |
| Two employer events overlapping | Full EOT (once) | Recoverable (once) | Do not double-count the same period |
EOT claim preparation steps that survive scrutiny
A defensible analysis is roughly half of a successful claim. The other half is the packaging — the sequence of procedural and evidential steps that make it straightforward for an assessor to say yes. Below is the sequence I have used on projects from small pump stations to multi-package transport programmes; it changes very little with contract value.
| # | Step | What it involves | Where claims fail |
|---|---|---|---|
| 1 | Confirm the contractual trigger | Identify the exact EOT clause, the relevant event, the notice period and whether notice is a condition precedent | Late or absent notice — the most common single point of failure |
| 2 | Secure the record trail | Diaries, photographs, RFI and IFC registers, delivery dockets, minutes, weather records, resource returns | Records assembled after the event and visibly reconstructed |
| 3 | Validate the baseline | Check logic, open ends, constraints, calendars, resource loading; confirm formal acceptance status | Measuring from a programme the employer never accepted |
| 4 | Establish cause and effect | Trace event → affected activity → longest path → completion date, with a dated fragnet or window | Asserting effect without showing the path |
| 5 | Select and justify the method | Choose TIA or windows on the basis of records held; state the reasoning explicitly in the submission | Method chosen for the answer it produces, not the evidence it fits |
| 6 | Test concurrency and mitigation | Apply the SCL logic; document mitigation attempted and acceleration instructed or constructive | Silence on mitigation, which reads as failure to mitigate |
| 7 | Write the narrative and link quantum | A readable story with figures, tables and appendices; time and cost linked to the same periods | A technical annex with no narrative an assessor can follow |
Step five deserves emphasis because it is the one most often skipped. Assessors are not hostile to methodology; they are hostile to unexplained methodology. Two paragraphs stating that windows analysis was adopted because monthly updates were accepted throughout, that TIA was rejected because the number of overlapping events would have produced an aggregate exceeding the actual overrun, and that the windows align to the contractual reporting cycle, will do more for a claim than another hundred pages of appendices. Quantify quantum with the SPI, CPI and EAC calculators before the negotiation, not during it.
Common mistakes across both methods
- ❌ Building the analysis around the answer — deciding the number first and then selecting the method that reaches it. Assessors and experts see this constantly, and it is easier to spot than practitioners assume.
- ❌ Using a corrupted baseline — negative lag, date constraints on the finish, activities with no predecessors. A baseline that cannot calculate a sensible critical path cannot support a delay analysis of any kind.
- ❌ Confusing delay with disruption — loss of productivity is a distinct head of claim requiring different evidence. Pushing disruption through a delay analysis usually loses both.
- ❌ Ignoring the as-built when running TIA — a prospective model that contradicts what visibly happened invites the obvious question, and there is rarely a good answer.
- ❌ Treating float as the contractor's property — unless the contract says otherwise, float is a project resource. Claiming EOT for an event that only consumed float is a fast way to lose credibility on the rest of the submission.
- ❌ Submitting without a narrative — if the assessor has to reconstruct your reasoning from schedule files, they will reconstruct it unfavourably.
Frequently asked questions
Which method do tribunals actually prefer?
There is no fixed hierarchy, but retrospective methods that engage with the as-built record — windows analysis in particular — tend to carry more weight in dispute proceedings than purely prospective models. That said, tribunals have accepted time impact analysis where the contract required contemporaneous assessment, and have rejected windows analysis where the underlying updates were unreliable. The determining factor is the quality of the input data, not the label on the method.
Can I combine time impact analysis and windows analysis in one claim?
Yes, and on complex projects it is often the strongest approach. A common structure is to run windows analysis as the primary method establishing the overall entitlement, then use focused time impact analyses within specific windows to demonstrate causation for individual contested events. What you must avoid is running both across the whole project and presenting whichever total is higher — that reads as method shopping and undermines everything else.
How many windows should a delay analysis use?
Enough that each window contains a manageable number of events, and few enough that the analysis stays readable. In practice, monthly windows work well on projects up to about two years. On longer programmes, quarterly windows with sub-analysis of contested periods keeps the volume sensible. If a single window contains six significant events, it is too wide to attribute cause reliably.
What happens if there is no accepted baseline programme?
You are not automatically out of options, but your position is materially weaker. The usual route is to construct an as-built programme from contemporaneous records and run a collapsed as-built or as-planned versus as-built comparison, being explicit about the limitation. Expect the assessor to discount the result. The better answer is preventative: get the baseline formally accepted at the start of every project, in writing, and re-baseline properly when scope changes.
Does the SCL Protocol have legal force?
No. It is guidance published by the Society of Construction Law and it says so itself. Courts and tribunals in several jurisdictions have referred to it with approval, and it is widely treated as a statement of good practice, but the contract governs. Where a bespoke amendment addresses concurrency or float ownership expressly, that wording prevails over anything in the Protocol.
How late is too late to submit an EOT claim?
That depends entirely on the contract. Many standard forms require notice within a defined period of the contractor becoming aware of the event, and some make that notice a condition precedent to entitlement — meaning a late notice extinguishes the claim regardless of merit. Detailed particulars can usually follow later. The practical rule is to notify early and broadly, then substantiate properly once the effect is measurable.
Should acceleration be claimed alongside an extension of time?
They are different remedies and should be pleaded separately. If acceleration was instructed, it is a variation and priced as one. If the contractor accelerated because a valid EOT was refused, that is a constructive acceleration argument — harder to run, and it requires evidence that entitlement existed, that it was requested, that it was denied, and that acceleration measures were taken and cost money. Document all four contemporaneously or the argument will not survive.
Keep exploring: the Academy home, learning tracks, knowledge pillars, publications, the founder page, the about page, the Project Controls Glossary, mega project case studies and the Project Failure Database.
Related guides on PMMilestone
Continue your reading with closely related Academy guides and references.
- Knowledge pillarConstruction Delay Analysis, EOTs & RecoveryFive forensic methods, concurrency, prolongation cost and recovery playbook for construction disputes.Open
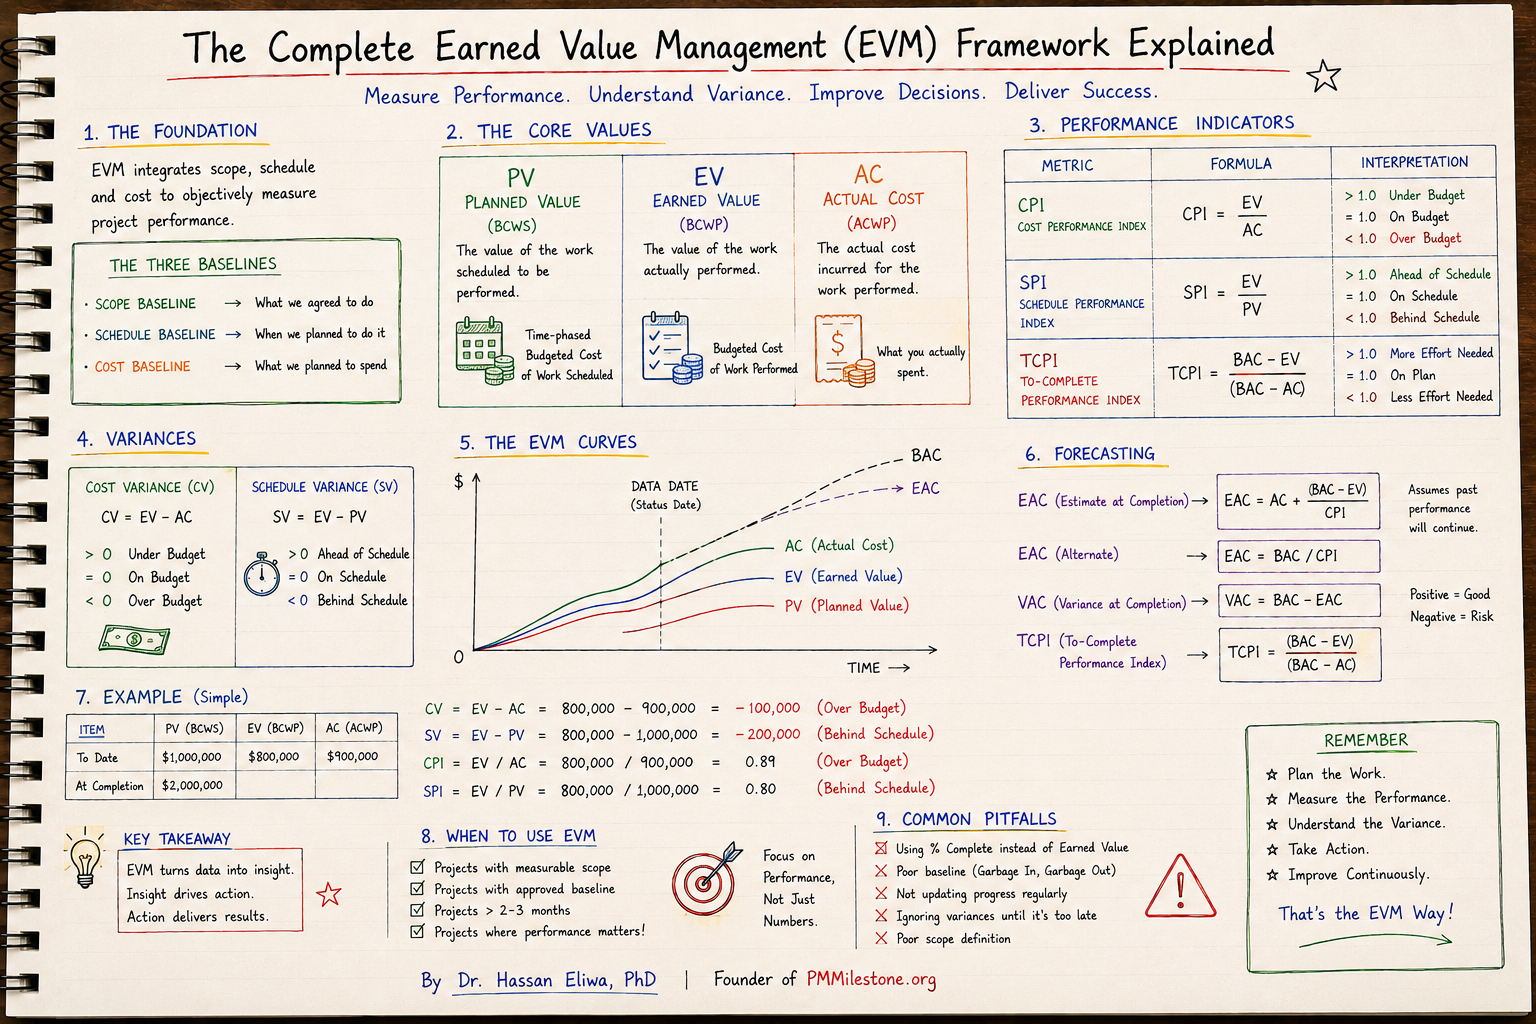
- Knowledge pillarEarned Value Management — Ultimate GuidePV, EV, AC, CPI, SPI, EAC, TCPI, S-curves and a worked construction example.Open
- Learning trackComplete Project Controls Certification Guide (2026)PMP, PMI-SP, PMI-RMP, CCP, PSP and EVP compared side by side for planning and cost professionals.Open
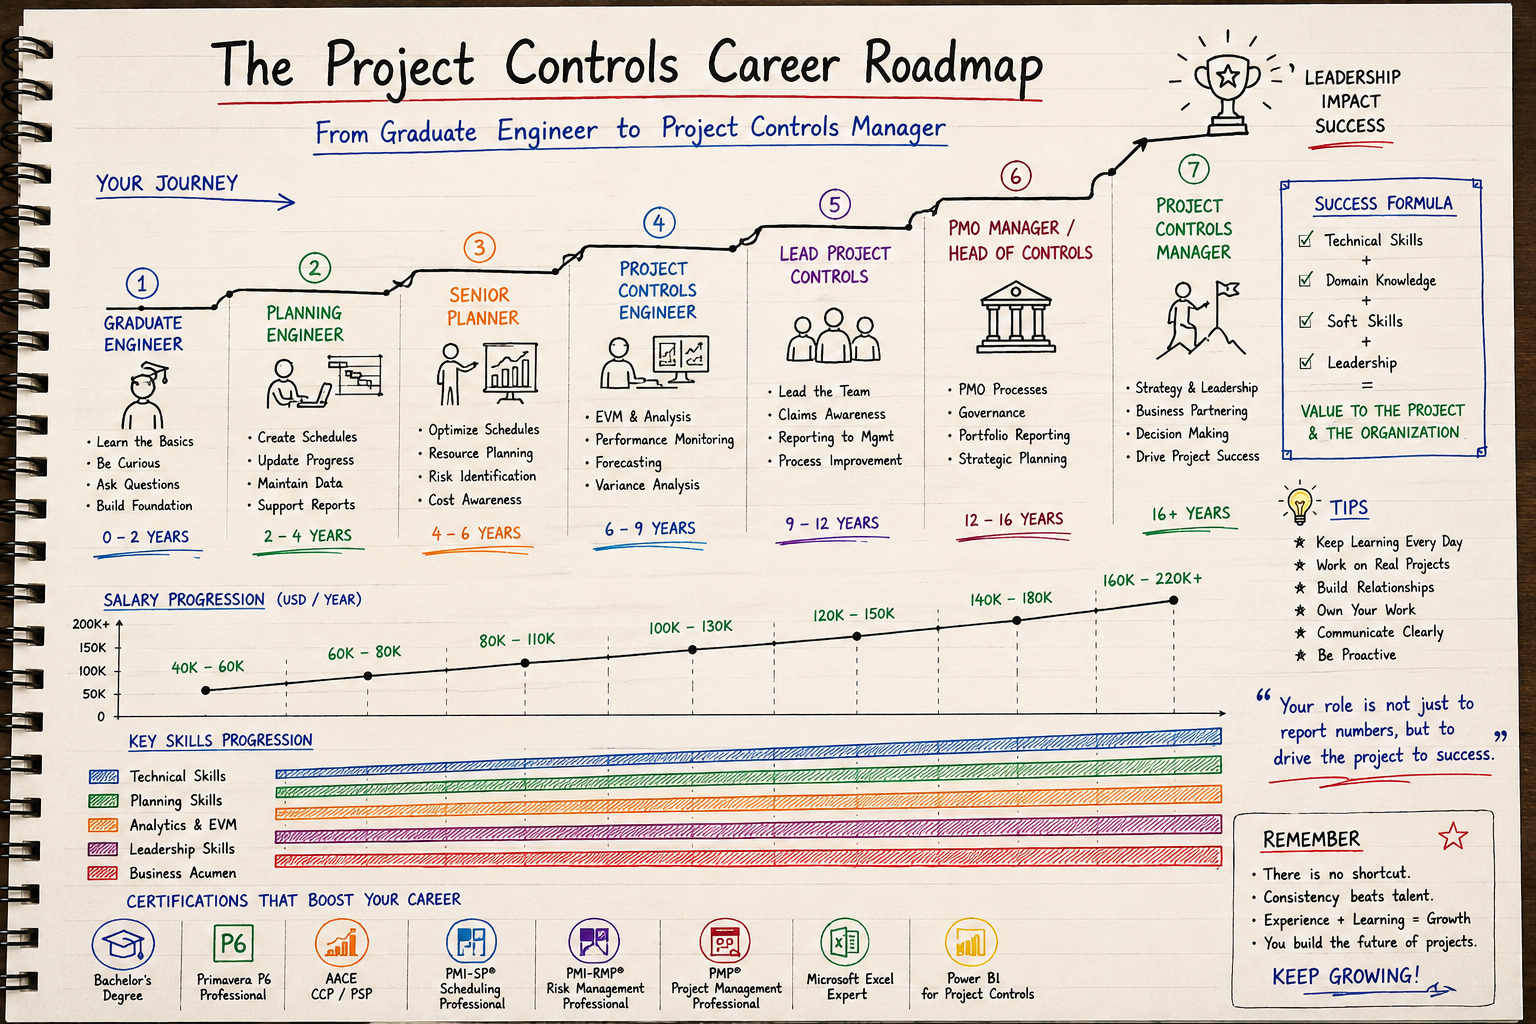
- Learning trackFrom Planning Engineer to Project Controls DirectorCareer roadmap with skills, certifications and salary at every stage from junior planner to director.Open
- ReferenceDelay Claims LibraryEOT, concurrent delay, disruption and time-entitlement reference library.Open
- ReferenceProject Failure Database15 mega-project case studies analysed through the project controls lens.Open
Related resources
Hand-picked tools, glossary entries, case studies and Academy pages to deepen this topic — curated by Dr. Hassan Eliwa, PhD.
Relevant calculators
Learning tracks
Knowledge pillars
Reference & glossary
Case studies & failures
Author & authority
- Founder — Dr. Hassan Eliwa, PhD
- About PMMilestone.org
- Publications by Dr. Hassan Eliwa
- Reviewed & maintained by the PMMilestone editorial team
Books by the author
- The Critical Path— CPM, schedule integrity and delay claims through a Dubai hospital project business novel
- Primavera P6 Step by Step — 2026 Edition— hands-on P6 tutorial with 60+ screenshots
- Build Your AI Project Manager with Claude— turn Claude into your PM co-pilot
- Construction Planning & Scheduling Handbook— WBS, CPM, EVM & delay analysis
- All books & publications →