Construction Delay Analysis: How to Choose the Right Method and Prove an Extension of Time


A claim that proved lateness, and lost
The first extension of time claim I ever worked on was rejected in eleven working days. Two hundred and forty pages, colour-coded appendices, a beautifully rendered as-built programme — and the engineer’s response was three paragraphs long. It said, in effect: you have shown us that the project finished late, but you have not shown us why the contract completion date should move.
That distinction took me years to fully absorb, and it is the single thing I now check before anyone on my team opens Primavera P6. Delay analysis is not a report about lateness. It is a causation argument, expressed in the language of a critical path network, and supported by records that existed before anybody thought there would be a dispute.
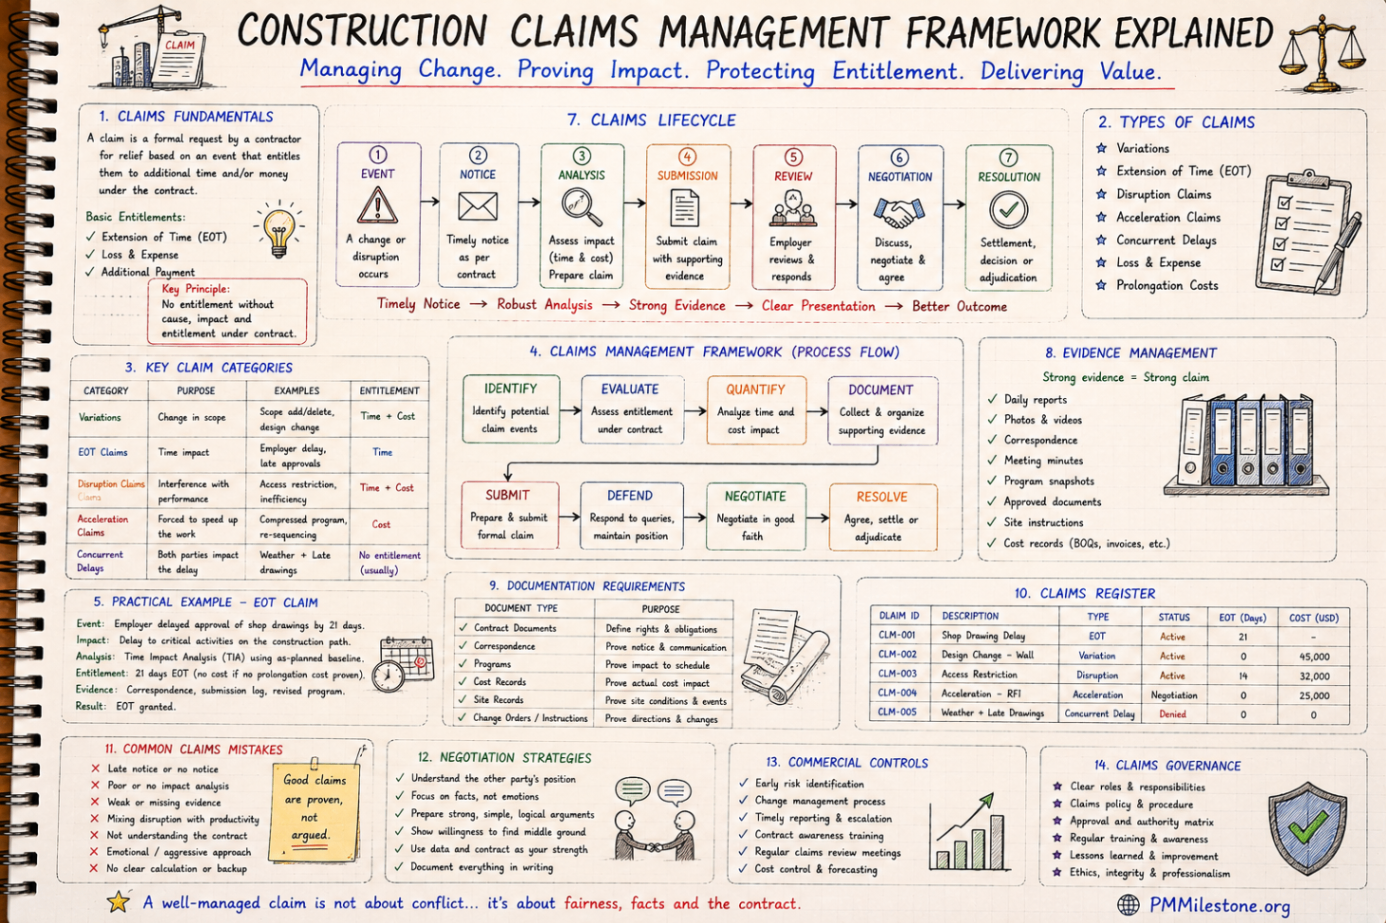
This article is the practical version of that lesson. It covers how to select a delay analysis method that your records can actually support, how to run it window by window, how to handle concurrency without hand-waving, and the mistakes I still see on projects worth hundreds of millions. Everything here comes from live projects — building, rail and roading — not from a textbook. It sits inside the Learning Tracks programme on PMMilestone Academy, and pairs directly with the Construction Delay Analysis knowledge pillar.
- ▸ The three questions every delay analysis must answer before it is credible
- ▸ A method-selection matrix mapped to the records you actually hold
- ▸ A worked window analysis, with the Gantt, the numbers and the entitlement split
- ▸ Concurrency explained without the legal fog, plus a float ownership discussion
- ▸ Common mistakes, expert tips and an FAQ drawn from real submissions
1. Delay analysis answers three questions — in this order
A delay analysis that is going to survive review must answer three questions, in sequence. If any one of them fails, the rest of the document is decoration.
On a rail station upgrade a few years ago, a contractor submitted a 62-day claim built entirely around question two. The records were excellent — daily diaries, signed inspection sheets, drone imagery every fortnight. But the delayed activity had 34 days of total float when the event struck. Only 28 days of the claim survived. The evidence was strong; the causation argument had simply never been made. If you want to see how quickly float disappears in practice, run your own numbers through the Float Erosion Analyzer and the Delay Impact Calculator.
| Question | What it establishes | Where analysts usually lose |
|---|---|---|
| What was the contractual obligation? | The baseline programme, the contract completion date, the sequence the parties agreed to, and the notice regime that governs claims. | Using a working programme that was never submitted or accepted as if it were the contract baseline. |
| What actually happened, and when? | The as-built record: actual start and finish dates, progress at each data date, and the delay events with their own start, end and impact dates. | As-built dates reconstructed from memory or back-filled from invoices instead of contemporaneous daily records. |
| Did the event delay completion? | The causal link between the event and the movement of the contract completion date along the critical path. | Proving the event happened, then assuming the delay follows. It does not follow automatically. |
2. Start with your records, not with your method
There is a habit in this industry of choosing the delay analysis method first — usually the one the analyst is most comfortable running — and then discovering halfway through that the records will not support it. Reverse the order. Audit the records, then let them tell you which methods are available to you.
Here is the readiness check I run in the first two days of any assignment. It takes a morning if the project has been well administered and a fortnight if it has not. Terminology used below — total float, data date, fragnet, as-built — is defined in the Project Controls Glossary.
| Record | Why it matters | Status |
|---|---|---|
| Baseline programme, formally submitted and accepted | Establishes the contractual sequence and the critical path at day zero. | ● Essential |
| Monthly programme updates with progress at each data date | Enables any window-based or time impact method. Without these, retrospective options narrow sharply. | ● Essential |
| Native schedule files (XER, XML), not PDF prints | Logic, calendars, constraints and float only exist in the native file. PDFs hide the mechanics. | ● Essential |
| Daily site diaries and labour/plant returns | Corroborate as-built dates and demonstrate resource impact for disruption. | ◆ High value |
| RFI, IR and variation registers with dates raised and answered | Convert a delay narrative into a dated, traceable event chain. | ◆ High value |
| Correspondence showing notices issued within the contractual period | Many claims fail on notice, not on merit. This is the first thing a reviewer checks. | ● Essential |
| Weather records against contractual baselines | Separates abnormal weather from the ordinary risk the contractor already priced. | ▲ Situational |
| Photographic and survey records tied to dates and locations | Independent verification when diaries are disputed. | ▲ Situational |
Ask for the native P6 XER files on day one, in writing, and ask for every monthly update — not just the latest. The single most common cause of a weak retrospective analysis is a project that kept overwriting one live schedule instead of archiving a dated copy each month. If that has happened, say so openly in your methodology section. A transparent limitation is survivable; a hidden one is fatal under cross-examination.
3. The six methods, compared honestly
The Society of Construction Law Delay and Disruption Protocol and AACE International’s Recommended Practice 29R-03 describe broadly the same family of techniques with different names. Rather than reproduce the taxonomy, here is how each one behaves in practice — including its reputation with reviewers, which matters more than most planners expect.
Two practical observations from running these on live projects. First, the observational methods — where you watch the critical path move through dated updates rather than inserting delays into a model — consistently attract less argument, because there is less of the analyst’s judgement embedded in the result. Second, the choice is frequently made for you: if the project produced twenty-two monthly updates with clean logic, a windows approach is almost automatic; if it produced four, you are into a modelled method and you should say why.
| Method | Type | Records needed | Cost / effort | Typical reviewer reaction |
|---|---|---|---|---|
| Impacted As-Planned | Prospective, theoretical | Baseline + delay events | Low | Weakest. Ignores what actually happened; often seen as contractor-favourable. |
| Time Impact Analysis (TIA) | Prospective, modelled | Baseline + updates + fragnets | High | Well regarded contemporaneously; criticised retrospectively as hypothetical. |
| Time Slice Windows | Retrospective, observational | Full set of dated updates | High | Strong. Follows the real movement of the critical path over time. |
| As-Planned vs As-Built Windows | Retrospective, observational | Baseline + reliable as-built | Medium | Very strong. The most commonly accepted method in UK and Gulf disputes. |
| Longest Path Analysis | Retrospective, observational | Reliable as-built network | Medium | Useful, but the as-built critical path can be contested. |
| Collapsed As-Built (But-For) | Retrospective, modelled | As-built with defensible logic | High | Divisive. Depends entirely on logic inserted after the fact. |
The picture the method has to explain
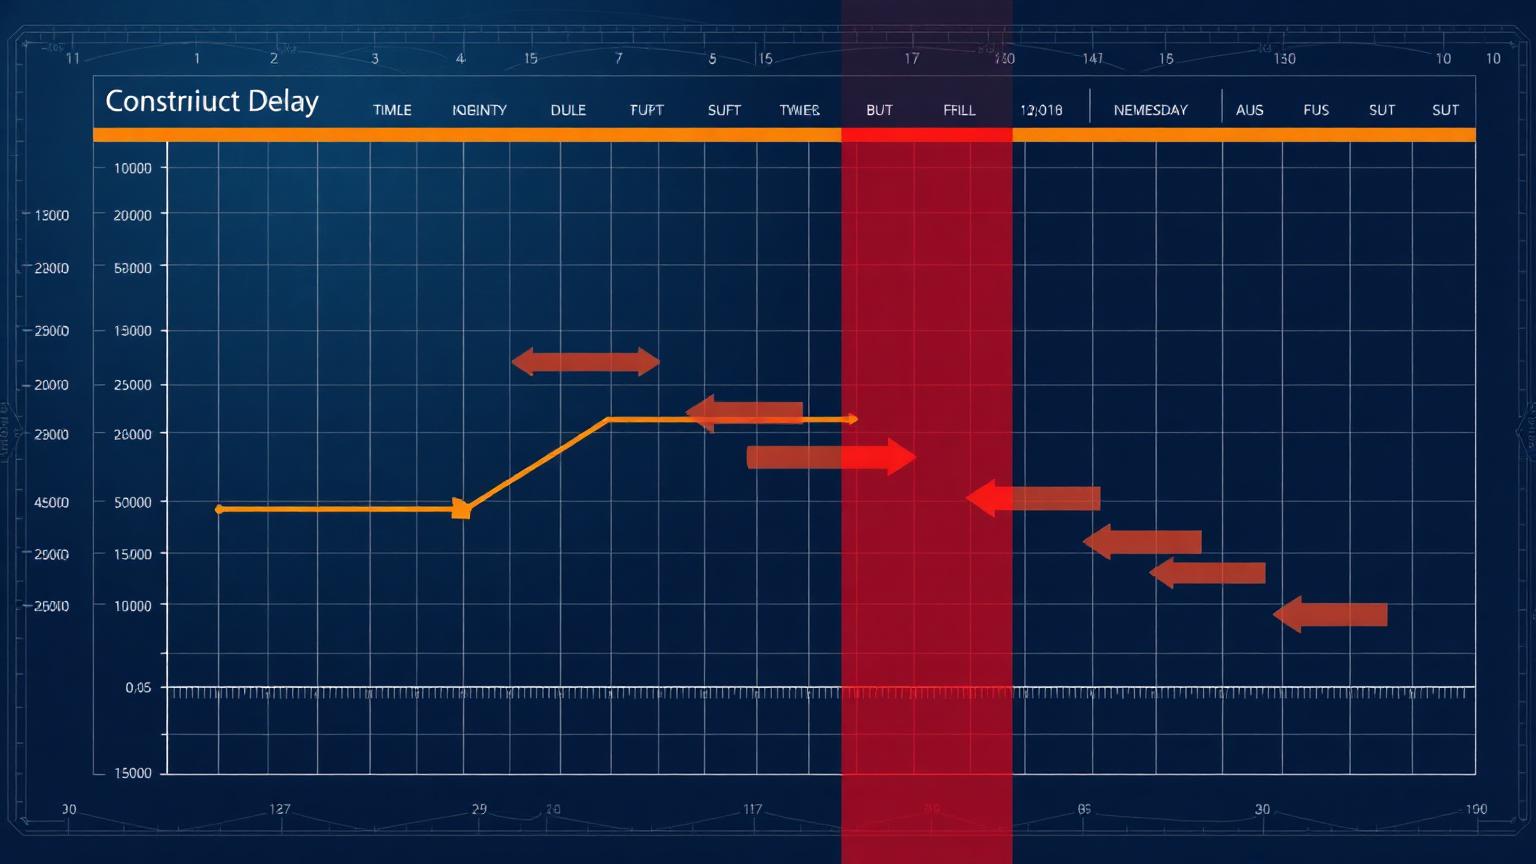
Below is the as-planned versus as-built comparison for an illustrative commercial tower — the kind of Gantt that opens a claim narrative. The blue bars are the accepted baseline, the amber bars are what actually happened, and the red segments are the portion of each activity that ran past its baseline finish.
Notice what this chart does and does not prove. It proves late finishes. It does not prove entitlement, and it does not tell you which of those late finishes were driving completion at the time. Piling finished 26 days late, and it is tempting to lead with that number — but if piling had float and the facade did not, the facade is where the claim lives. Comparable patterns across real programmes are collected in the Mega Project Case Studies and the Project Failure Database.
Figure 1 — Baseline versus as-built Gantt chart. The 70-day slip is visible; the causation is not. That is the analyst’s job.
4. Choosing the method: a decision matrix
This is the matrix I use with clients in the scoping meeting, before any fee is agreed. It has saved more arguments than any other single page in my toolkit.
| Your situation | Recommended method | Why |
|---|---|---|
| Delay is happening now; you need a prospective EOT under the contract | Time Impact Analysis | Models the effect at the moment of impact and mirrors the decision the engineer must make today. |
| Project complete; you hold monthly updates throughout | Time Slice Windows or As-Planned vs As-Built Windows | Uses contemporaneous evidence of how the critical path actually moved. Hardest to attack. |
| Project complete; updates are sparse or unreliable | As-Planned vs As-Built Windows using reconstructed windows | Retains a factual spine while acknowledging the gap. Declare the reconstruction openly. |
| Low-value dispute, limited fee, proportionate approach needed | Simple As-Planned vs As-Built | Proportionality is a legitimate consideration. Do not spend NZD 90,000 analysing a NZD 200,000 claim. |
| Defending against a claim you believe is overstated | Mirror the claimant’s method, then run one alternative | Beating them on their own method is persuasive. A second method tests robustness of the result. |
| No baseline was ever accepted | Reconstructed baseline + windows, with heavy caveats | Weight will be reduced, but a transparent reconstruction beats an unexplained one. |
5. Not every delay day is a claim day
This is the concept that separates planners from delay analysts, and it is worth labouring. A project can record 180 days of disruption across sixty activities and still be entitled to zero days of extension, because none of those activities was on the critical path when it slipped.
On the tower project above, late design information produced 38 recorded delay days. Only 26 of them landed on the critical path. Client-instructed variations produced 32 days, but 18 of those were absorbed by float in the fit-out sequence. If you submit the gross figures, a competent reviewer will find the difference within a day and your credibility on every other number drops with it. The Variation Order Impact Calculator and the Critical Path Risk Score are useful for sanity-checking which events are genuinely path-driving.
Figure 2 — Recorded delay days split between critical path impact and float absorption, across six cause categories.
Present the gross-to-net bridge yourself. A table that shows ‘recorded delay 122 days → non-critical 77 days → concurrent 21 days → claimed 24 days’ reads as rigour. The same 24-day claim presented without the bridge reads as a guess, and invites the reviewer to build their own bridge — which will not be generous.
6. Concurrency, without the fog
Concurrent delay is where most submissions become vague, usually deliberately. The honest version is short: where an employer risk event and a contractor risk event are both, at the same time, causing critical delay to completion, the generally applied position under the SCL Protocol is that the contractor gets time but not money for that period. Time relief protects against liquidated damages; prolongation cost recovery does not follow.
The arguments in practice are rarely about the principle. They are about whether the two events were truly concurrent — same period, both critical, both effective — or merely simultaneous in the diary.
Two disciplines make concurrency arguments winnable. First, record the contractor’s own delays as carefully as the employer’s — analysts who present a project where nothing went wrong on their side are not believed, and rightly so. Second, test concurrency at the level of the critical path, day by day, not at the level of the month. Two events in the same month are not concurrent; two events driving the same critical path on the same days are. Worked precedents and drafting examples sit in the Delay Claims Library.
| Event | Party at risk | Days critical | Overlap | Outcome |
|---|---|---|---|---|
| Late structural steel approval | Employer | 15 | 8 days with EV-07 | EOT for 15 days; prolongation cost for 7 days only |
| EV-07 Insufficient welding crews | Contractor | 11 | 8 days with the above | No EOT; contractor absorbs cost through the overlap |
| Net window position | — | 15 critical days | 8 concurrent | 15 days time, 7 days money |
7. A window analysis, start to finish
Here is the mechanical process for an as-planned versus as-built windows analysis, using the tower project. Eight windows, roughly monthly, each bounded by a data date.
The result: 70 days of slip, of which 49 days were established as excusable and 36 days as compensable after concurrency was applied. That is not a triumphant number, and it should not be. A claim that recovers every day of slip is almost always a claim that has not tested itself.
- Set the window boundaries at the actual data dates of the programme updates. Do not invent tidy calendar months if the updates were irregular.
- At the start of each window, identify the critical path and record the forecast completion date.
- Overlay the as-built progress for that window and identify which activities on the critical path failed to achieve their planned progress.
- Measure the movement in forecast completion across the window. That figure is the window’s delay, regardless of what happened elsewhere in the network.
- Allocate that movement to specific, dated events using the correspondence and site records — not to categories such as ‘design delays’.
- Classify each allocation: excusable and compensable, excusable and non-compensable, or contractor risk.
- Carry the residual position forward and repeat. The critical path will change between windows; that is the point of the method.
Figure 3 — Cumulative forecast slip against established excusable delay. The gap between the two bars is the contractor’s own exposure.
| Window | Critical path driver | Slip in window | Cumulative slip | Excusable | Classification |
|---|---|---|---|---|---|
| W1 | Site establishment | 0 | 0 | 0 | — No movement |
| W2 | Bulk excavation | 4 | 4 | 0 | ▲ Contractor resourcing |
| W3 | Bulk excavation | 5 | 9 | 5 | ● Unforeseen ground conditions |
| W4 | Piling | 18 | 27 | 16 | ● Ground + ▲ concurrent plant breakdown |
| W5 | Basement structure | 6 | 33 | 3 | ◆ Design information (partly concurrent) |
| W6 | Superstructure | 15 | 48 | 12 | ● Variation instruction VO-14 |
| W7 | Facade | 14 | 62 | 8 | ◆ Late approvals + ▲ subcontract mobilisation |
| W8 | Fit-out | 8 | 70 | 5 | ● Utility diversion by others |
8. Common mistakes I still see every year
None of the mistakes below are exotic. They appear in submissions from large, capable contractors every year, and each of them hands the reviewer an easy reason to discount the whole document.
| ✖ Mistake | What goes wrong | The fix |
|---|---|---|
| Claiming from the last update only | A single before-and-after comparison hides every critical path change in between. | Analyse in windows. Show the path moving. |
| Treating float as the contractor’s private asset | Most standard forms say float belongs to the project until consumed; assuming otherwise inflates claims. | Check the contract wording, then state your float position explicitly in the methodology. |
| Open-ended delay events | Events with a start date but no finish date cannot be modelled and read as speculative. | Every event needs a start, a finish, an impact date and a document reference. |
| Retrospective logic changes | Adding links to the baseline so the delay becomes critical is the fastest way to lose credibility. | Freeze the accepted logic. If a change is unavoidable, log it in a documented change register. |
| Ignoring the notice regime | A technically perfect analysis of a claim notified 40 days late may still be time-barred. | Audit notice compliance first. If notice is weak, say so and address it directly. |
| Category-level causation | ‘Design delays: 34 days’ proves nothing. Which drawing, which RFI, which activity? | Trace every day to a dated document and a schedule activity ID. |
| Mixing delay with disruption | Disruption is a productivity loss claim; delay is a time claim. Blending them confuses both. | Run them as separate analyses with separate evidence, cross-referenced. |
9. Expert tips that shorten the argument
✔ Write the methodology section before you run the analysis. If you cannot justify the method in a page, you have chosen the wrong one.
✔ Number every delay event (DE-01, DE-02) and use those references consistently across the narrative, the schedule fragnets, the tables and the appendices. Reviewers navigate by reference numbers.
✔ Run a schedule quality check on the baseline before relying on it — open ends, negative lags, excessive constraints, out-of-sequence progress. If the baseline fails a health check, address it up front instead of letting the other side find it.
✔ Keep the analysis reproducible. Someone should be able to take your XER files and your event register and land within a day or two of your result.
✔ Present the counter-argument yourself, in one short section. It costs you three paragraphs and buys a great deal of credibility.
✔ Update the analysis monthly during execution rather than reconstructing it two years later. The cost difference is roughly an order of magnitude, and the quality difference is larger. Where acceleration is on the table, model it first with the Schedule Compression Calculator, and corroborate the narrative with the SPI Calculator and Earned Schedule Calculator.
A closing thought
The best delay analysis I have ever read was fourteen pages long. It had one Gantt chart, three tables and an appendix of dated correspondence. It won because every single day claimed could be traced to a document, an activity ID and a movement in the critical path — and because it conceded, without being asked, the twelve days that were the contractor’s own fault. Rigour is more persuasive than volume. It has been the most reliable rule in twenty years of doing this work.
Dr. Hassan Khames Eliwa, PhD, is a project controls specialist working across building, transport and infrastructure programmes, with more than twenty years of experience in planning, scheduling, earned value management, forensic delay analysis and claims. Read more on the Founder page, the About PMMilestone page and in the peer-reviewed Publications library.
Continue from here: the Learning Tracks index for structured progression, the Knowledge Pillars for the underlying disciplines, and the Academy home for everything else.
References
Society of Construction Law. (2017). Delay and Disruption Protocol (2nd ed.). Leicestershire, UK: SCL.
AACE International. (2011). Recommended Practice No. 29R-03: Forensic Schedule Analysis. Morgantown, WV: AACE International.
AACE International. (2011). Recommended Practice No. 49R-06: Identifying the Critical Path. Morgantown, WV: AACE International.
Project Management Institute. (2021). A Guide to the Project Management Body of Knowledge (PMBOK® Guide) — Seventh Edition. Newtown Square, PA: PMI.
Defense Contract Management Agency (DCMA). (2012). 14-Point Schedule Assessment. Washington, DC: DCMA.
Frequently asked questions
Which delay analysis method is the best?
There is no universally best method — only the method your records can support and your contract permits. Where contemporaneous updates exist and the project is complete, an as-planned versus as-built windows analysis is the most widely accepted approach in practice. Where you are seeking a prospective extension during execution, time impact analysis reflects the decision the engineer must make at that moment. The SCL Protocol is guidance, not law; the contract terms come first.
Can I claim an extension of time without a baseline programme?
Yes, but the weight given to your analysis will be lower. You would reconstruct a baseline from tender documents, method statements and early progress records, then state clearly that it is a reconstruction and explain the assumptions. Reviewers accept reconstructed baselines routinely; what they do not accept is a reconstruction presented as though it were an accepted contract programme.
Who owns the float — the contractor or the employer?
It depends entirely on the contract. Many standard forms treat float as belonging to the project, meaning it is available to whichever party needs it first, and an extension is only granted when the delay pushes past available float. Some bespoke amendments allocate float explicitly. Never assume; quote the clause in your methodology section.
How long should a delay analysis take?
For a project with clean monthly updates and a well-kept event register, a windows analysis on a two-year project typically runs four to eight weeks including narrative and appendices. Where records must be reconstructed, three to six months is common. Most of the effort sits in evidence assembly, not in the schedule software.
What is the difference between delay and disruption?
Delay concerns the completion date: an event pushes the critical path and the project finishes later. Disruption concerns productivity: the same work is performed less efficiently, costing more labour hours, without necessarily moving the completion date. They require different evidence and different analytical techniques, and blending them into a single claim tends to weaken both.
Does an unfavourable Schedule Performance Index prove delay?
No. SPI and other earned value indicators are useful corroborating evidence and excellent early warning signals, but they measure work performed against work planned across the whole project — not movement of the critical path. An entitlement argument must be built on the network, with earned value used to support the narrative rather than carry it.
Can software generate a delay analysis automatically?
Software can do the mechanical work extremely well: parsing schedule files, comparing data dates, identifying critical path changes, quantifying slip per window and producing consistent tables. What it cannot do is establish causation or interpret the contract. Automation removes the tedious 60 percent and lets the analyst spend the time on the 40 percent that decides the outcome.
When should I start the delay analysis?
The month the first critical delay appears. Contemporaneous analysis is cheaper, more accurate and far more persuasive than a retrospective exercise, because the records and the people who created them are still on site. If you are reading this while the project is running, that is the single highest-value action available to you today.
Where this article connects
Curated cross-links: related Academy articles, the Knowledge Pillars this topic draws on, and the calculators referenced in the FAQs above.
Related Academy articles
Relevant Knowledge Pillars
Next steps on PMMilestone
Use these pages to deepen the topic, verify terminology, compare real cases and move from theory into applied project controls practice.
Related calculators
Open the calculators referenced in this article and run them against your own project numbers.
Delay Impact Calculator
Estimate the financial impact of project delays.
Open ScheduleFloat Erosion Analyzer
Track total float consumed on critical paths.
Open ScheduleCritical Path Risk Score
Score the fragility of your critical path.
Open ConstructionVariation Order Impact Calculator
Variation value as % of contract.
Open ScheduleSchedule Compression Calculator
Cost per day of crashing the schedule.
Open Earned ValueSPI Calculator
Schedule Performance Index — measure schedule efficiency.
Open ScheduleEarned Schedule Calculator
Time-based schedule performance (SPI(t)).
OpenOther learning tracks
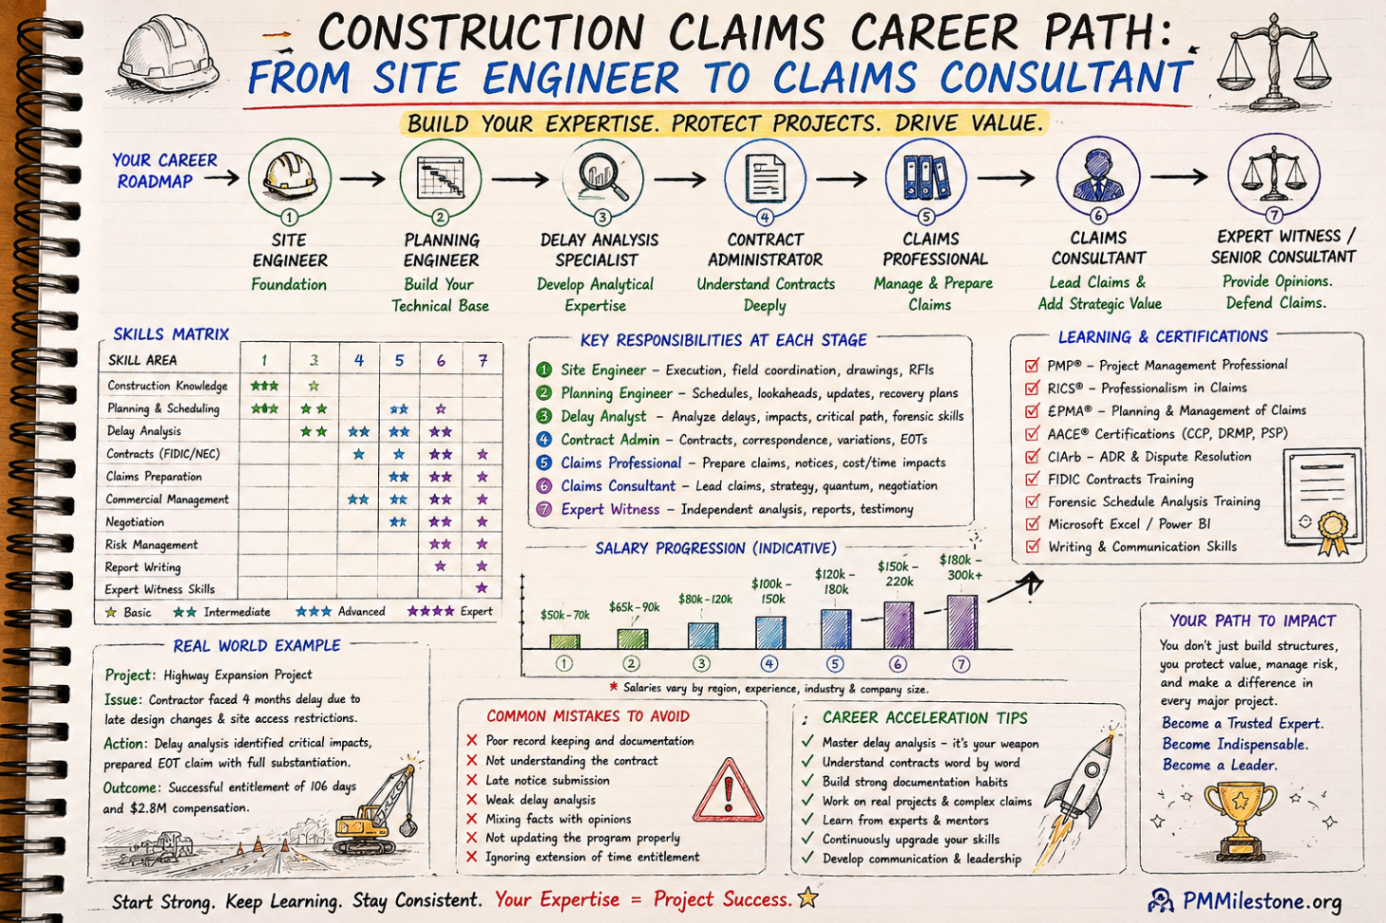
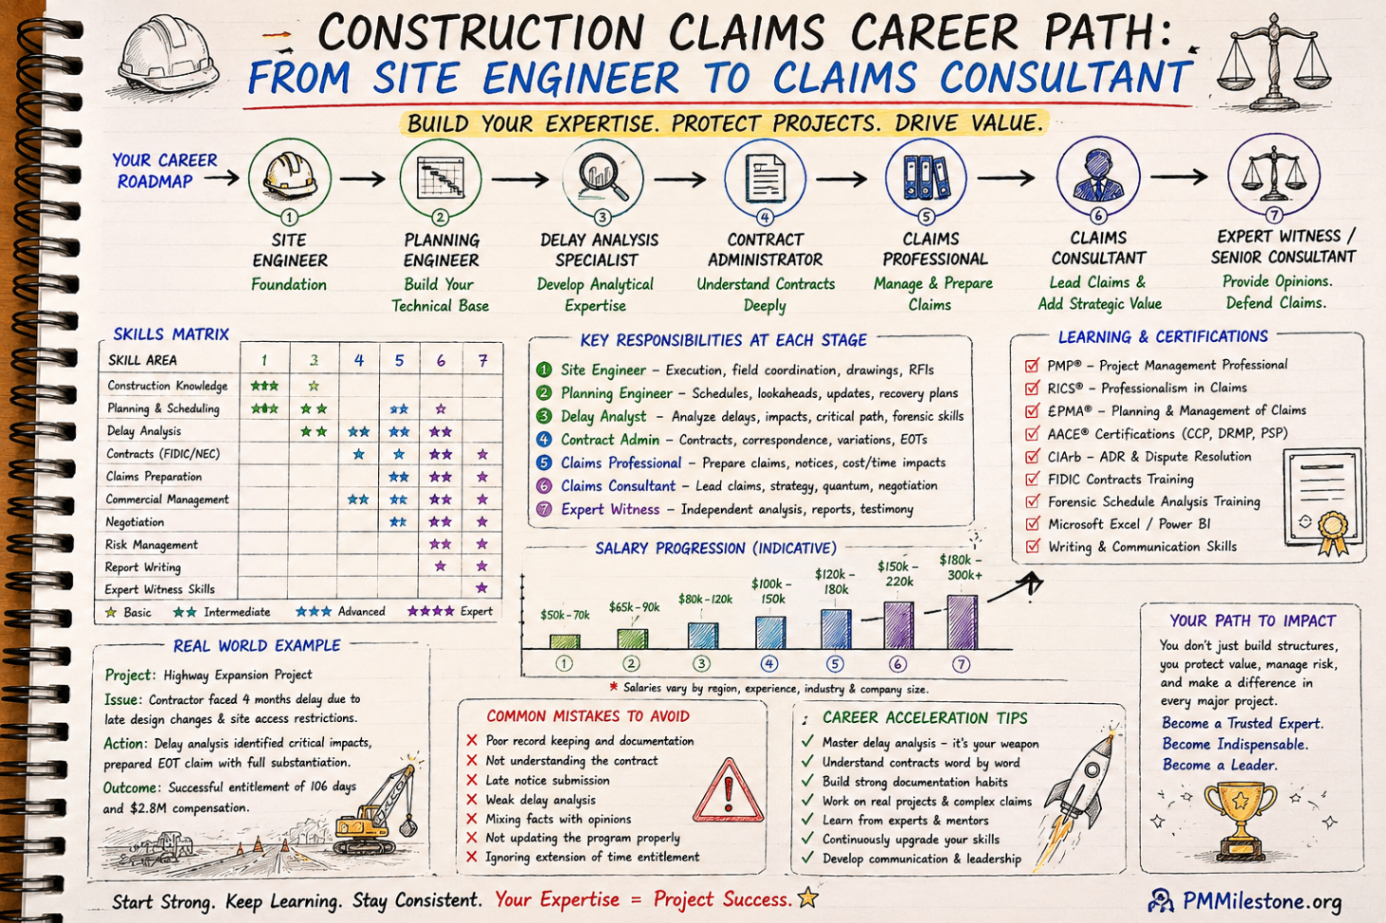
Construction Claims Career Path
A practical roadmap for engineers moving from site delivery into planning, delay analysis, claims, commercial controls and senior claims consulting.
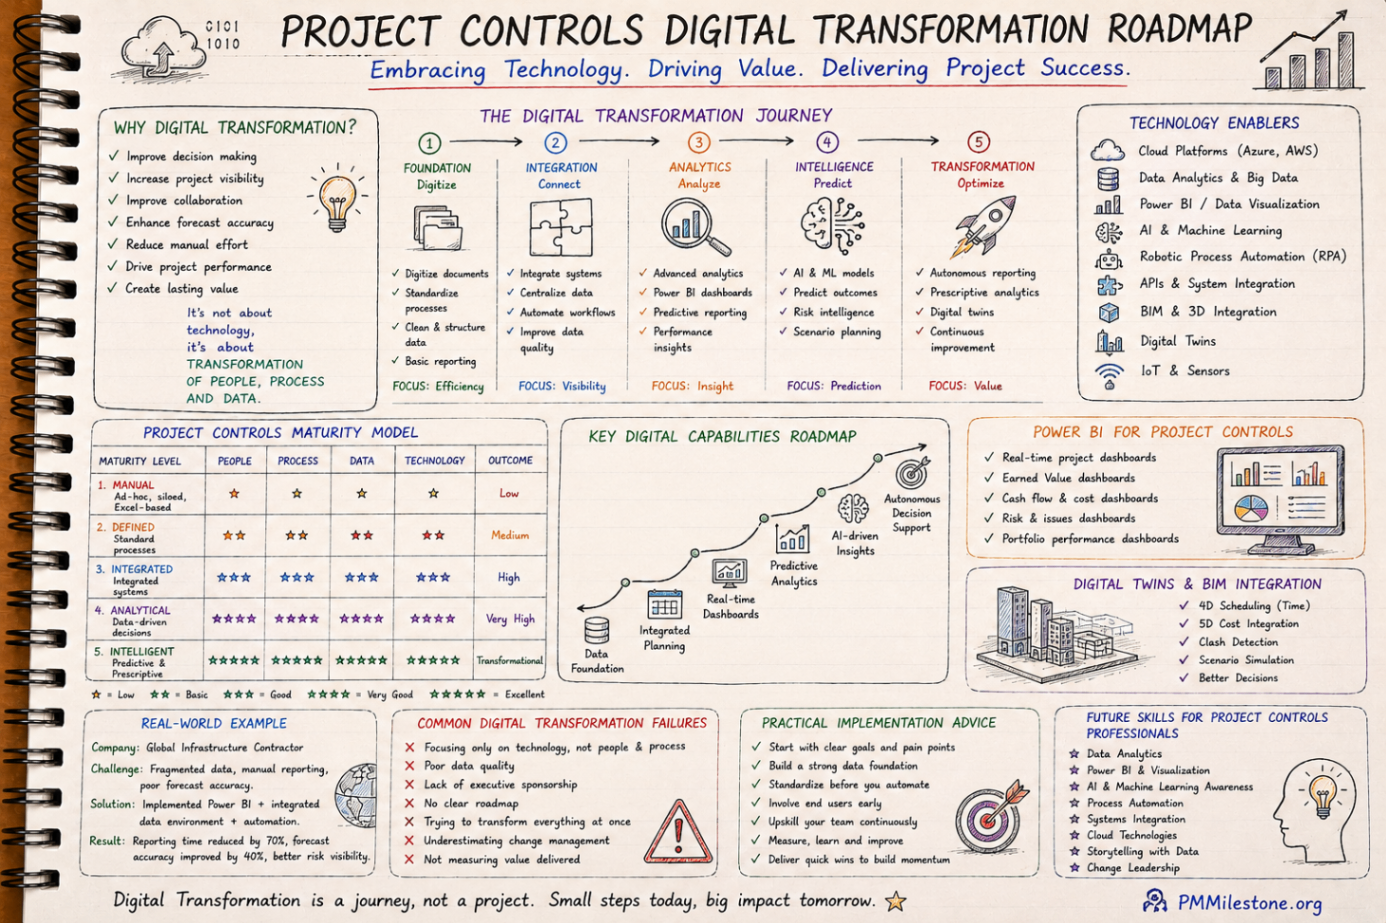
Project Controls Digital Transformation Roadmap
A future-focused guide to modern project controls through data integration, reporting automation, Power BI, AI, BIM and digital PMO capability building.
Project Controls Fundamentals
Scope, schedule, cost, risk, quality and reporting — the six disciplines that hold every successful capital project together, taught from first principles.