Schedule Entropy: Why Great Schedules Slowly Become Chaotic

The quietly frustrating experience every planner has lived through
Every planner has lived through this quietly frustrating experience. You issue a baseline that is, honestly, a thing of beauty — the logic is clean, the float sits where it should, resources are levelled, and there is not a single dangling activity. Three or four update cycles later you open the same programme and barely recognise it. Constraints have multiplied like weeds, relationships have been re-pointed to patch progress, out-of-sequence work has crept in, and the forecast finish date wanders every time you re-run the critical path.
The schedule did not collapse overnight. It decayed. That slow, almost invisible slide from order into disorder is what many of us call schedule entropy, and after two decades on infrastructure and building programmes I'm convinced it is one of the most useful mental models a planner can carry. It reframes a messy programme not as a personal failure, but as a natural tendency that has to be actively resisted — every single week.
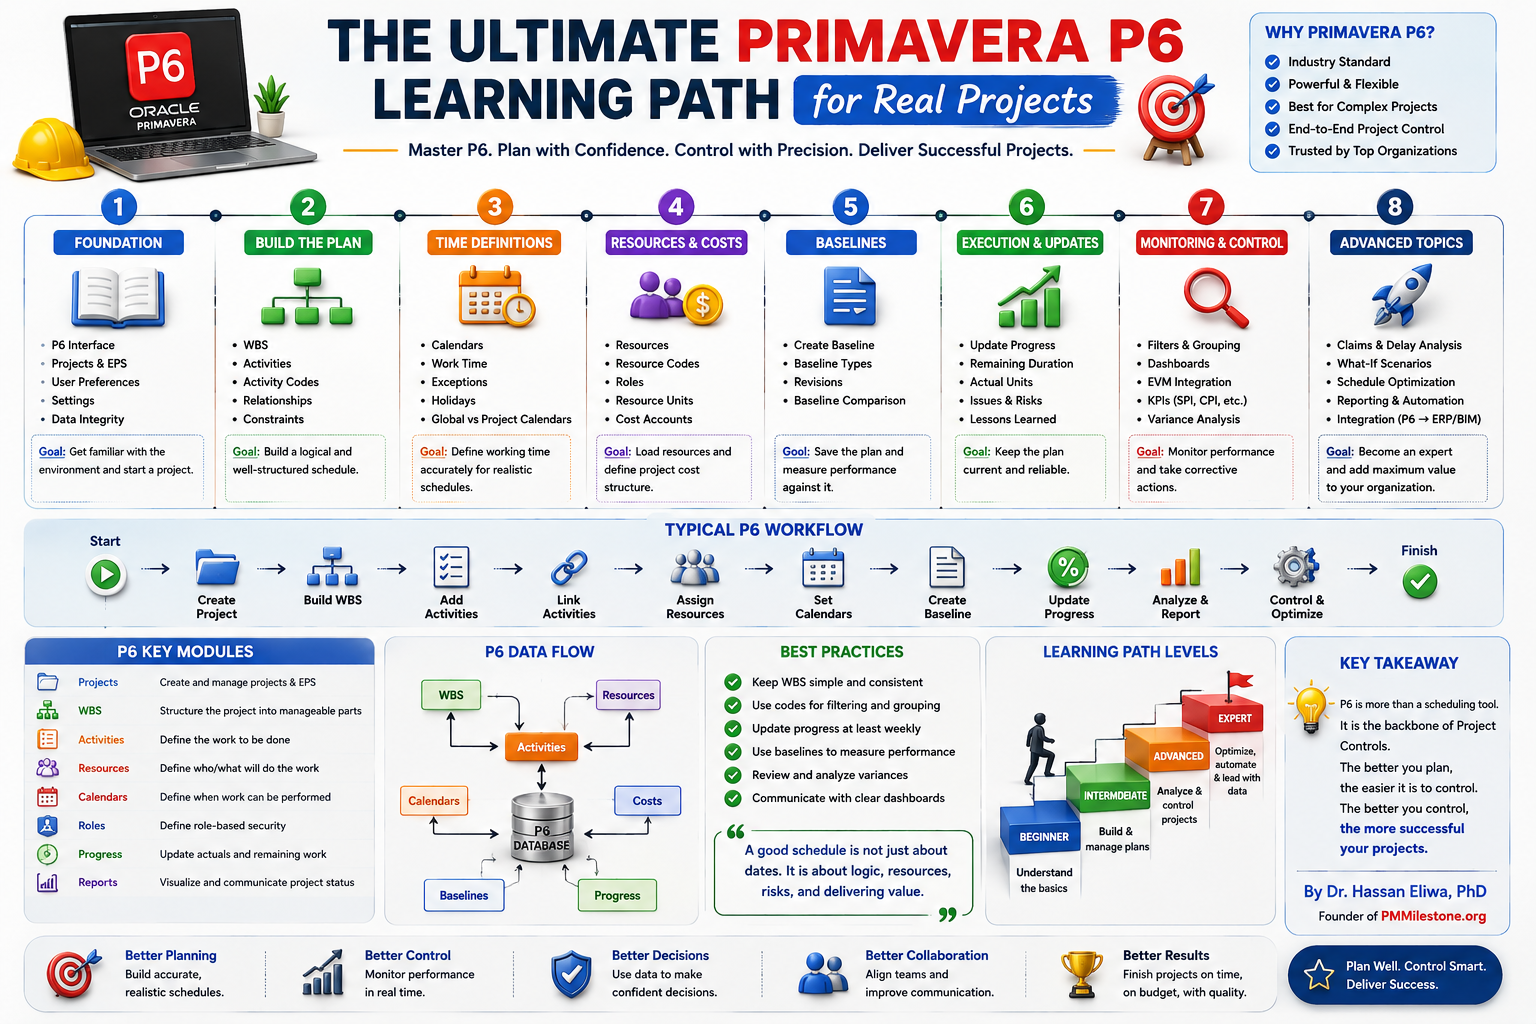
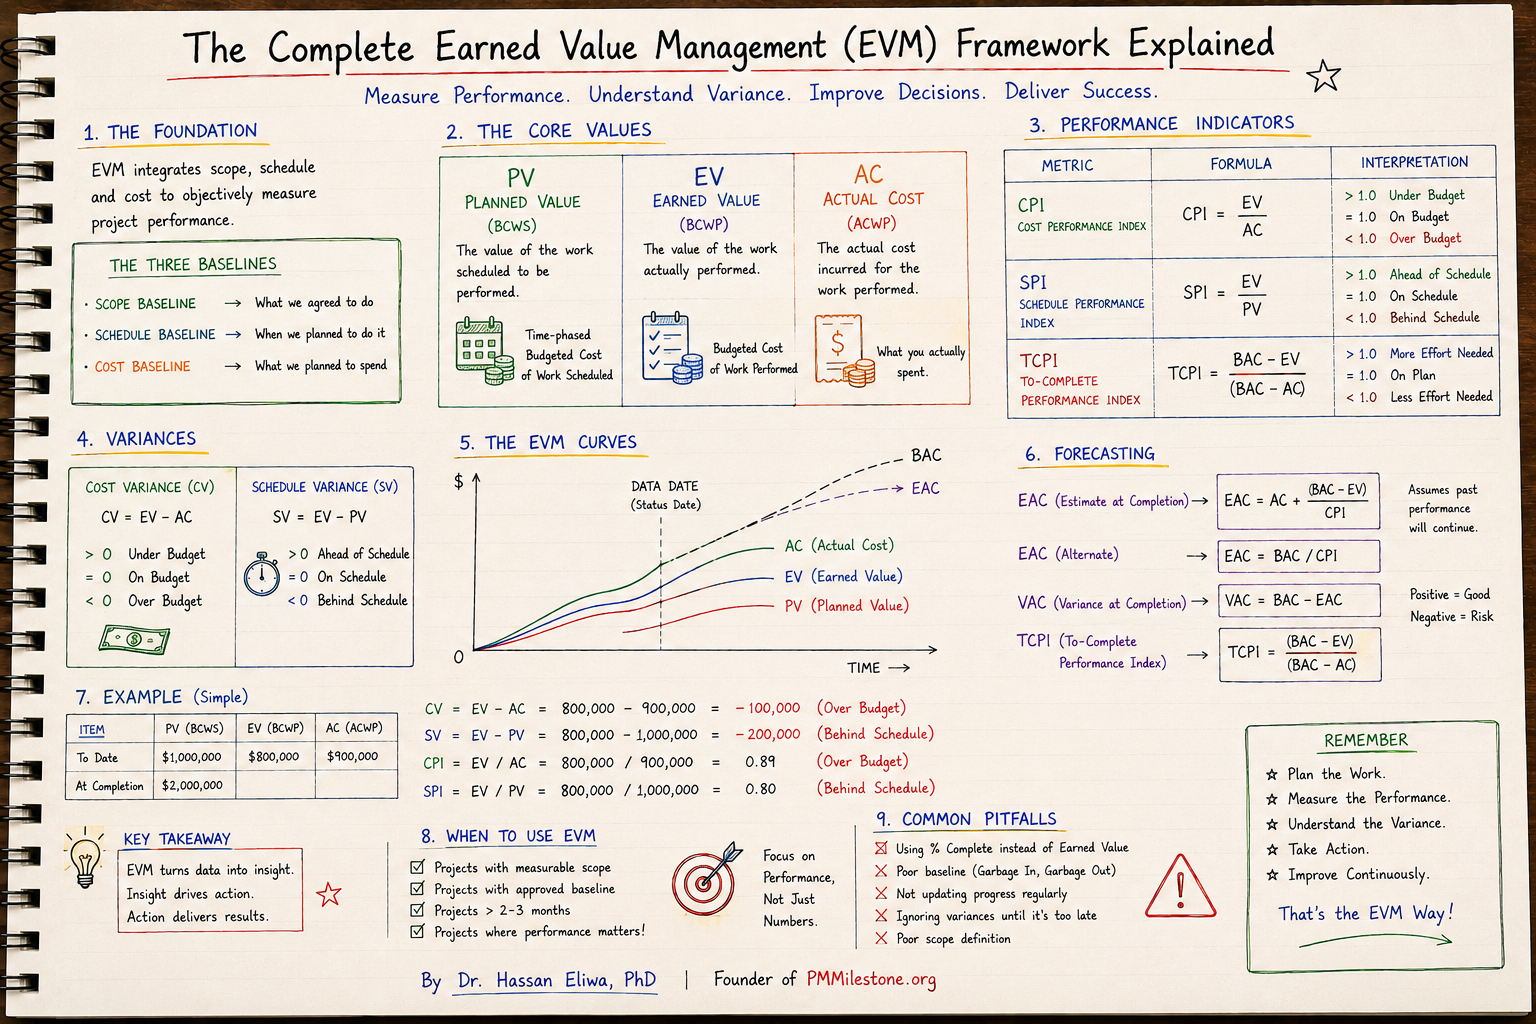
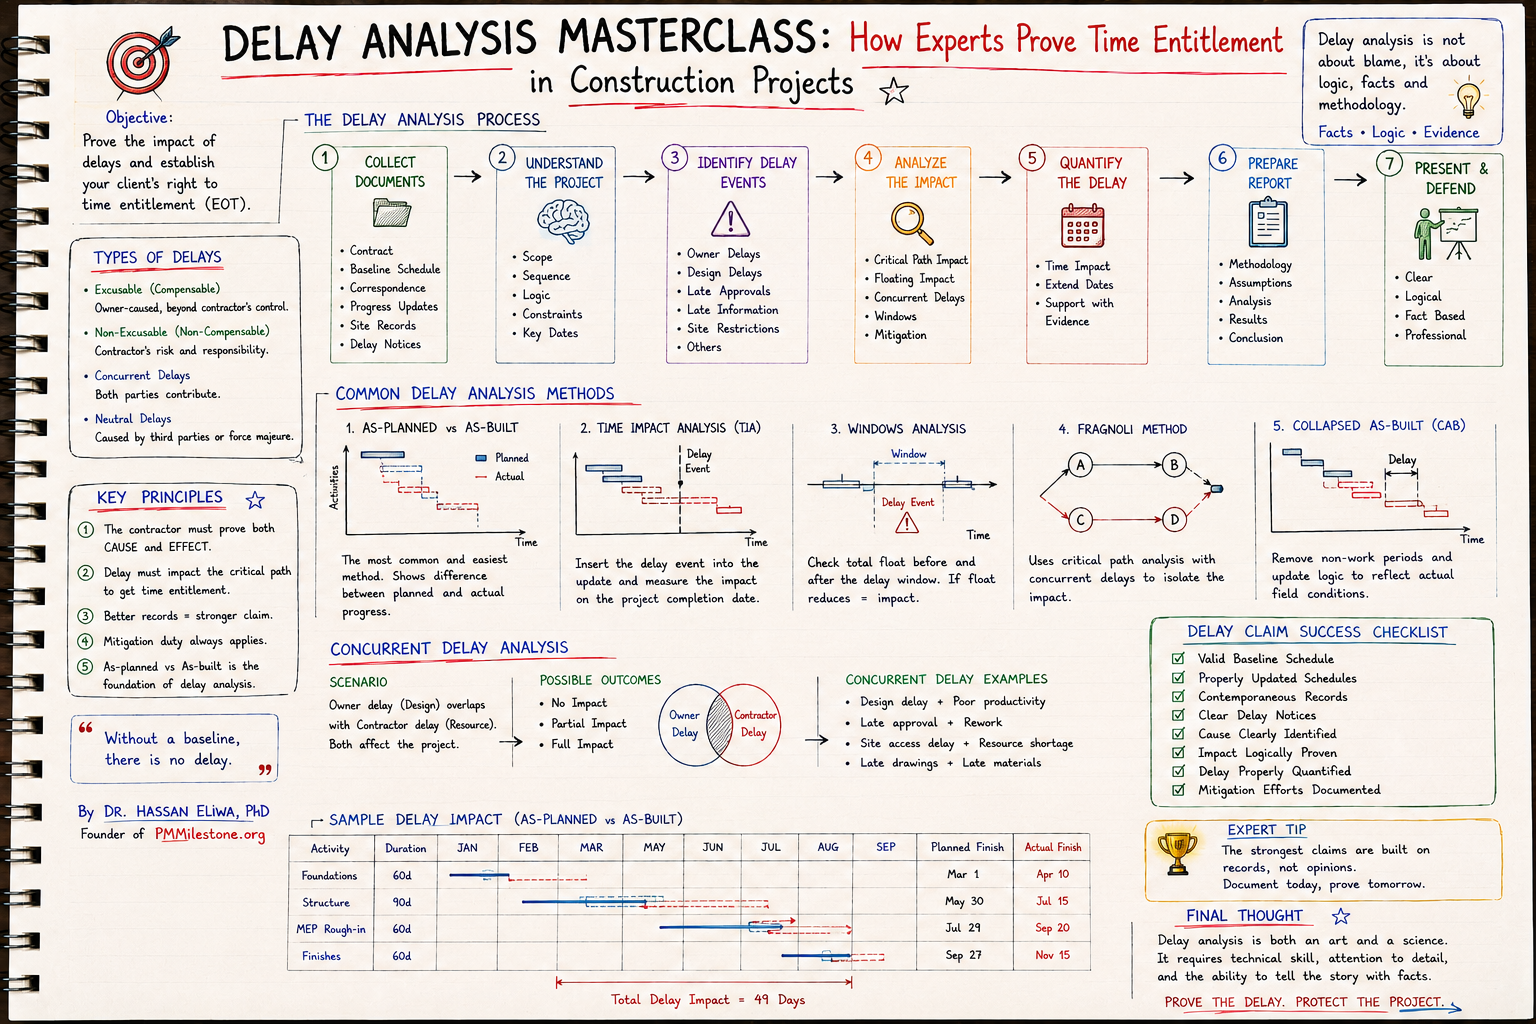
This article pairs naturally with the Primavera P6 learning path, the 10-minute P6 read, the EVM Ultimate Guide knowledge pillar, and the Construction Delay Analysis pillar. Definitions live in the Project Controls Glossary.
Borrowing a law from physics
In thermodynamics, the second law tells us that an isolated system tends toward disorder unless energy is put into it. A tidy room becomes cluttered. A hot coffee cools to room temperature. Order is expensive to maintain; disorder is free. Your Primavera P6 or Microsoft Project schedule obeys a strikingly similar rule. Left alone — updated hastily, patched under deadline pressure, never audited — a programme will always trend toward chaos. The energy you put in as a planner is the discipline that keeps entropy low.
I first named this pattern for myself on a metro station package where the tender schedule had 1,400 activities and almost perfect logic. By the time we were eighteen months into construction the same file had swelled past 2,600 activities, carried 140-odd hard constraints, and produced a completion date that moved by three weeks in either direction depending on which planner had run the last update.
Nobody had done anything obviously wrong. Entropy had simply accumulated, one reasonable-looking edit at a time. Similar patterns appear across the Project Failure Database and the Mega Project Case Studies.
The four stages of drift
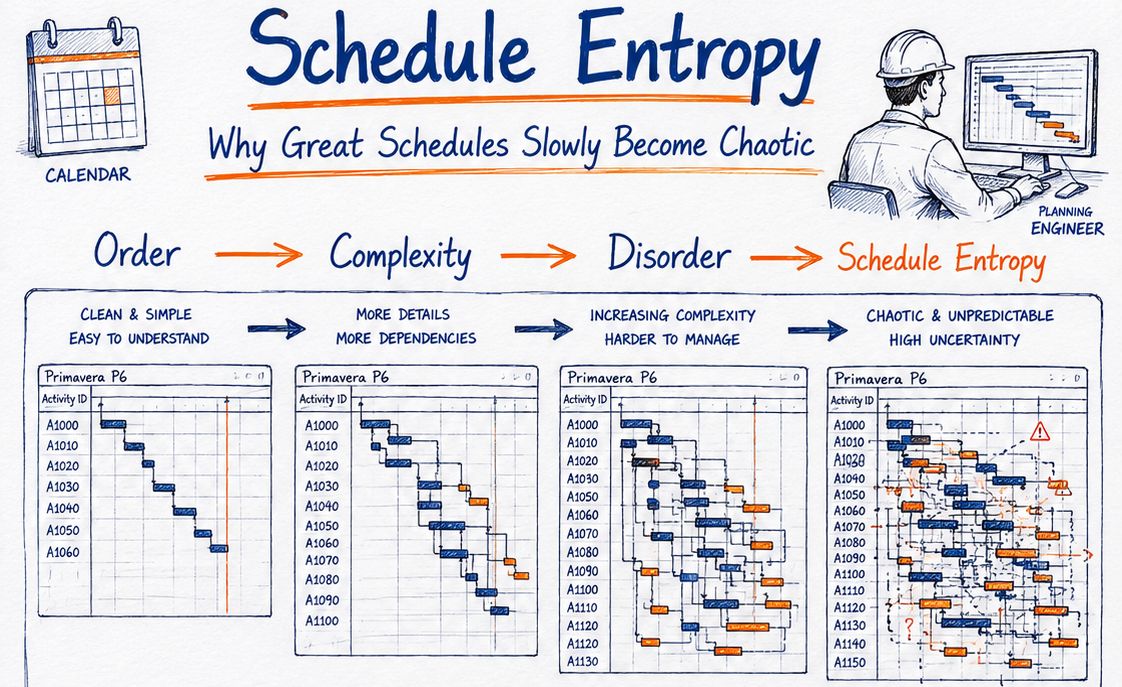
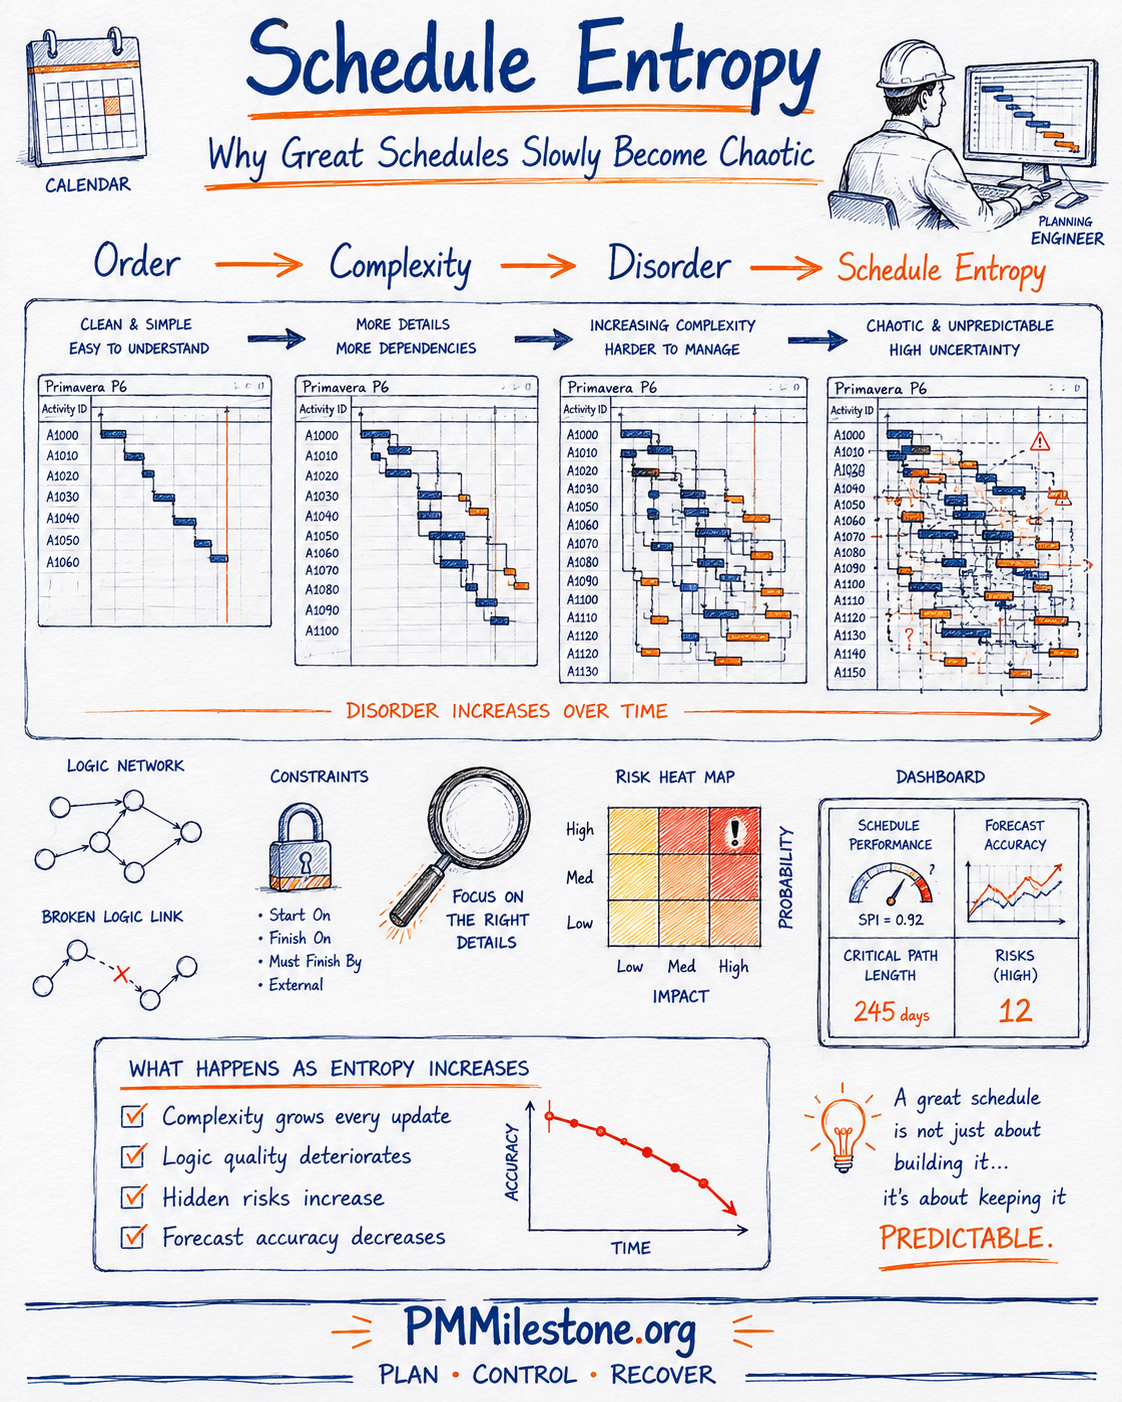
Schedule entropy rarely arrives as a single dramatic event. It moves through recognisable stages, and the sooner you can spot which stage you're in, the cheaper the correction. The progression below — from Order, through Complexity and Disorder, into full Schedule Entropy — is the backbone of how I explain the problem to project teams.
Stage 1 — Order: clean and simple. At handover the baseline is easy to read. A stakeholder can trace a path from foundations to handover in seconds. Relationships are almost entirely finish-to-start, lags are rare and justified, and the critical path tells an honest story. This is the state every planner should fight to preserve, because everything downstream is cheaper when the network stays legible.
Stage 2 — Complexity: more detail, more dependencies. As design matures and subcontractors are onboarded, the schedule gains detail — and it should. But detail is not free. Every new activity brings relationships, and every relationship is a small liability. On a bridge deck package I worked, the pour sequence alone grew from 12 activities to 90 as the temporary-works engineer refined the design. The schedule was more accurate, yet noticeably harder to hold in your head. Complexity is healthy up to a point; the danger is when it grows faster than the logic quality can keep up.
Stage 3 — Disorder: harder to manage. Now the cracks show. Progress is applied out of sequence, so activities finish before their predecessors start. Someone adds a constraint to force a milestone to look achievable. Open ends appear where relationships were deleted rather than re-logic'd. The critical path starts jumping between updates. You can still deliver from this state, but you're steering with a foggy windscreen.
Stage 4 — Schedule entropy: chaotic and unpredictable. At the far end, the network is effectively unreadable. Dozens of constraints override true logic, dangling activities float free, and the forecast finish is driven more by manual overrides than by calculated dates. The schedule has stopped being a forecasting tool and become a reporting formality. This is the state that quietly destroys stakeholder trust, because the numbers no longer mean anything.
What it looks like on the bars
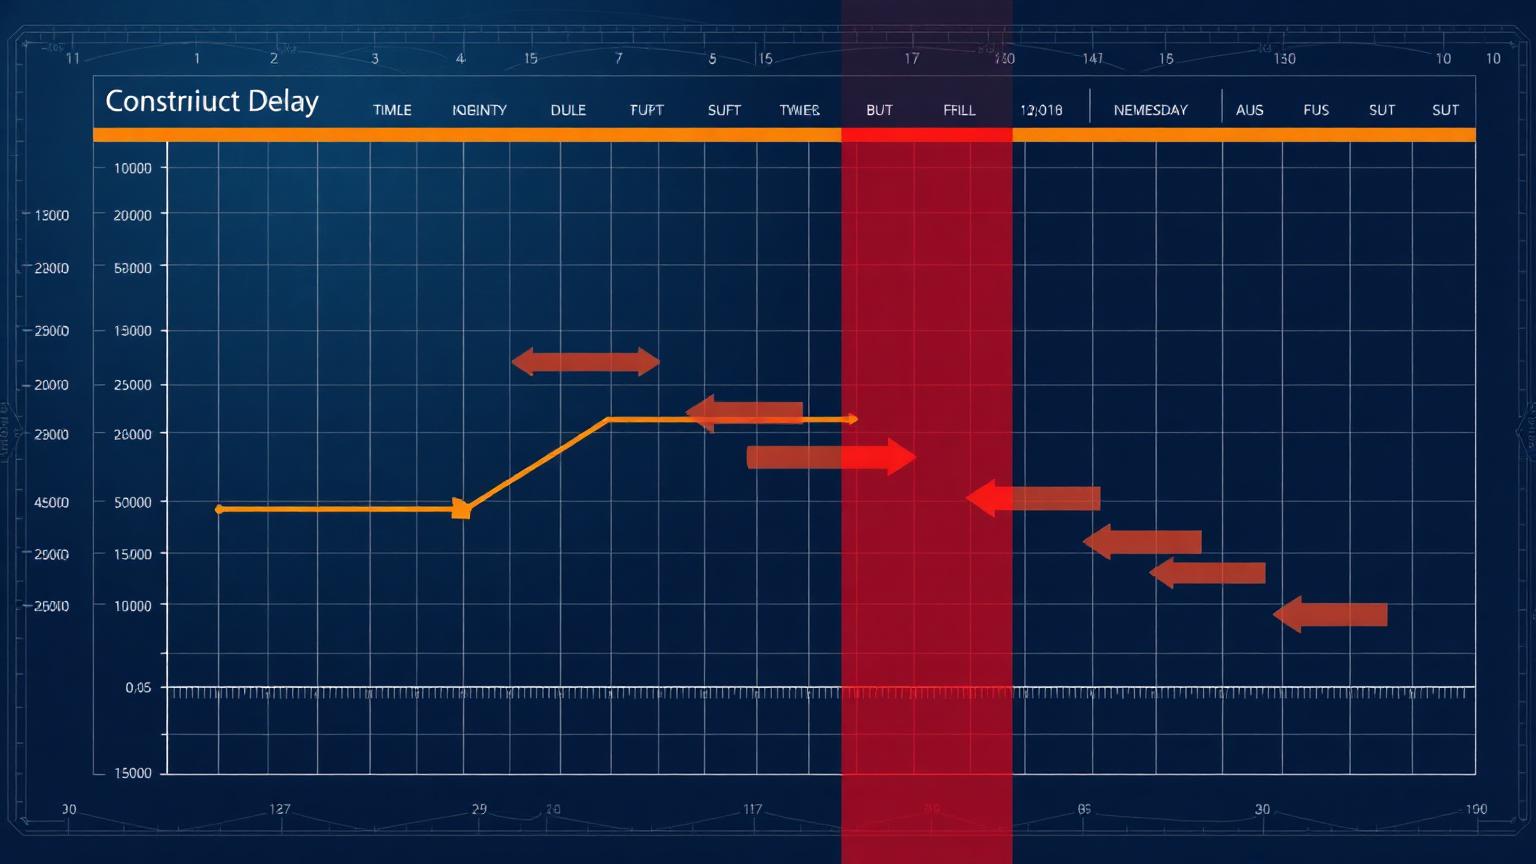
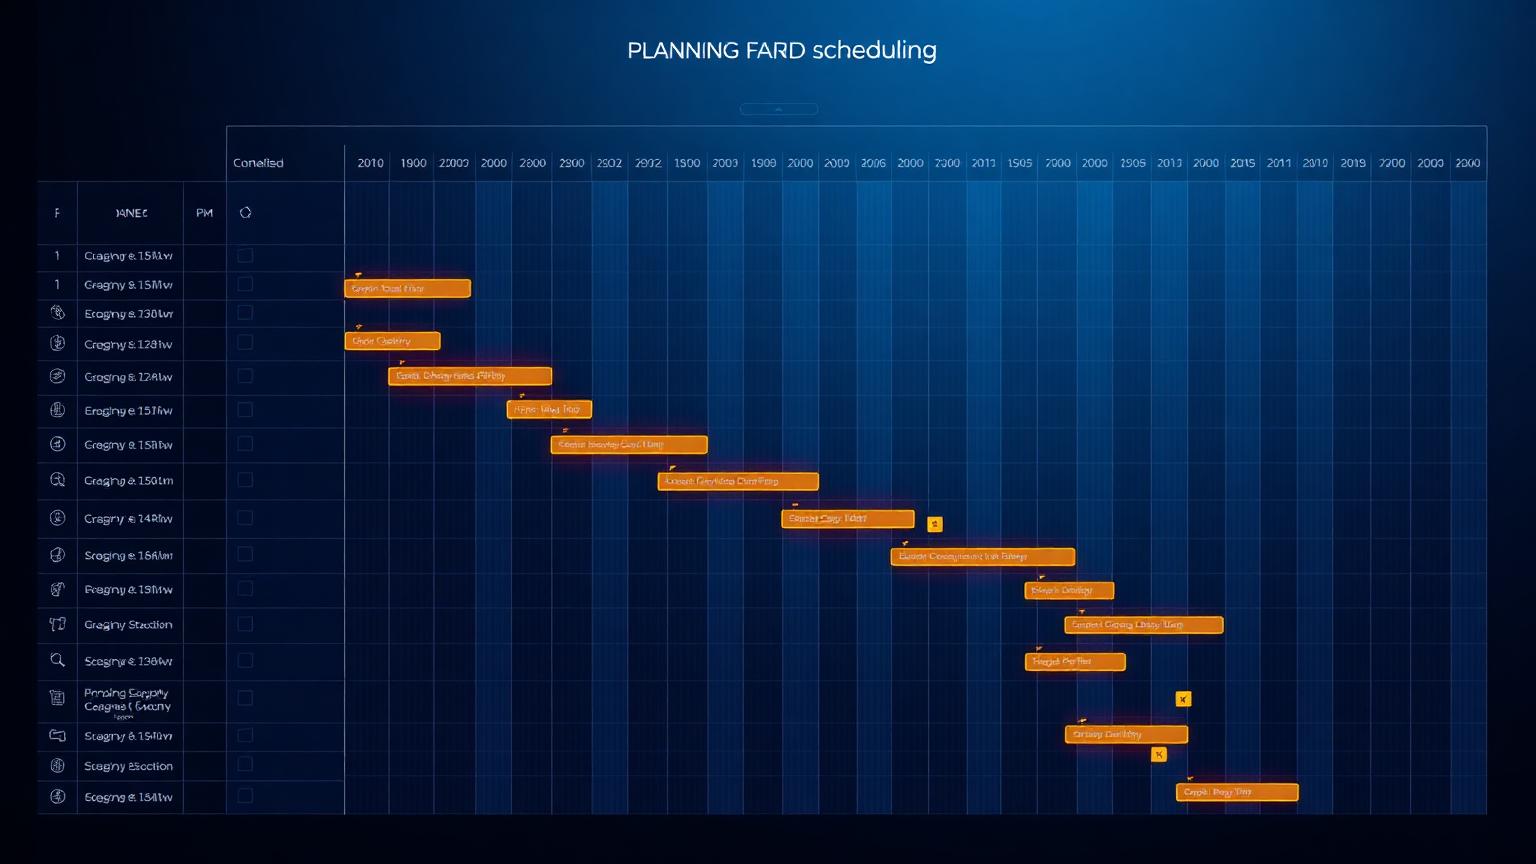
The abstract idea becomes concrete the moment you look at the Gantt. Below is the same programme in two states: on the left an ordered baseline — a clean staircase, one activity flowing into the next; on the right the same schedule after entropy has set in, with overlaps that were never planned and slipped activities in amber.
| Activity | Order — low-entropy baseline | Disorder — high-entropy drift |
|---|---|---|
| A1000 | 2–8 | 5–12 |
| A1010 | 8–14 | 10–18 |
| A1020 | 14–20 | 15–22 |
| A1030 | 20–26 | 17–23 |
| A1040 | 26–32 | 18–25 |
| A1050 | 32–38 | 18–27 |
| A1060 | 38–44 | 18–27 |
| A1070 | 44–50 | 25–30 |
| A1080 | 50–56 | 28–35 |
| A1090 | 50–56 | 33–42 |
Forecast accuracy erodes as entropy accumulates
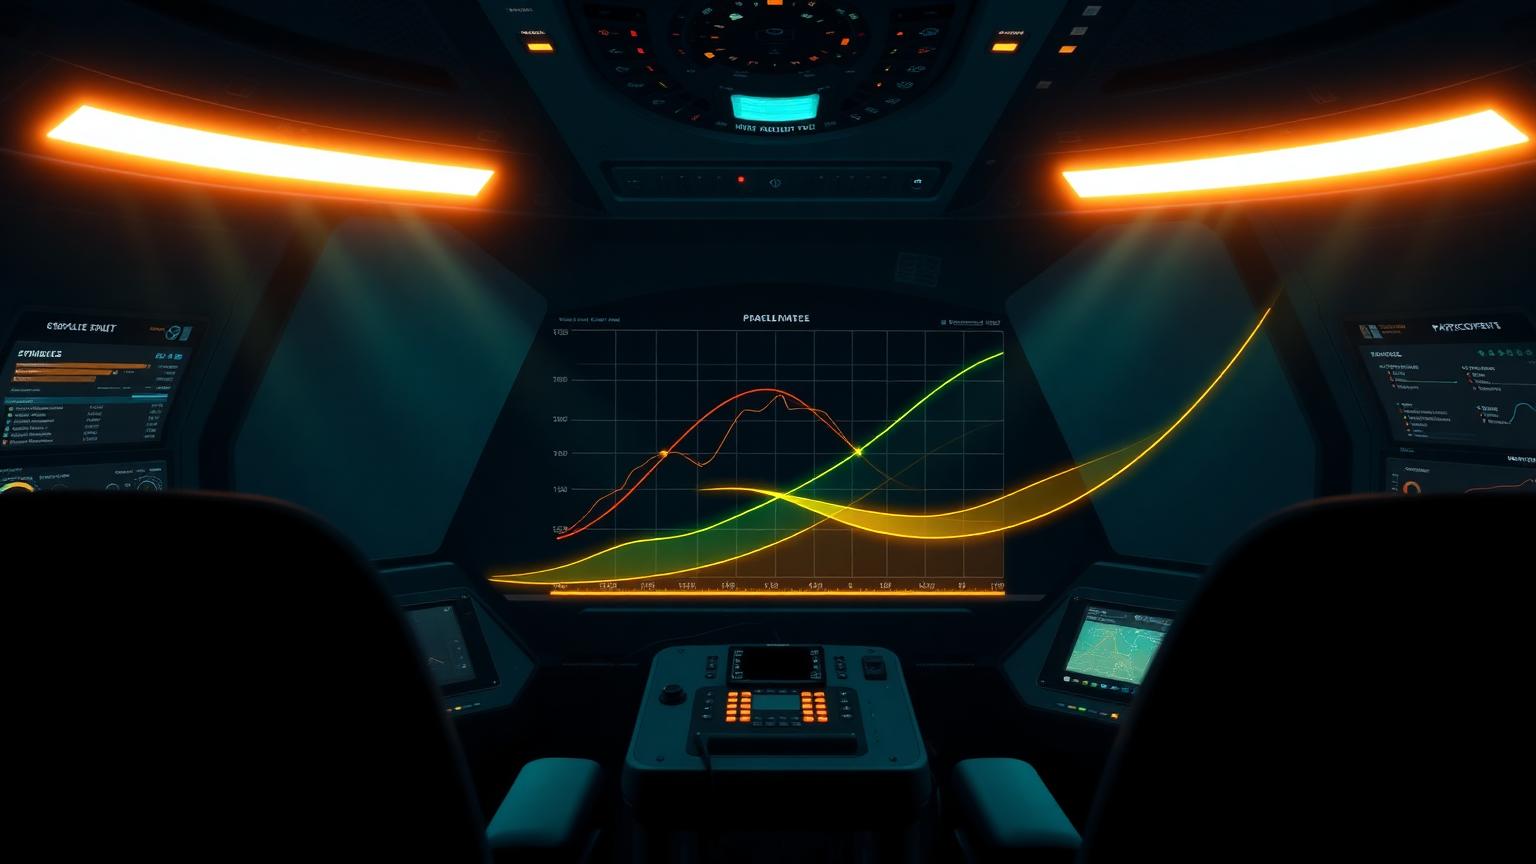
The cruelest part of entropy is what it does to your forecast. Because each update carries a little more disorder, the accuracy of your predicted finish erodes over time. The pattern I sketch for project managers to make the point is simple: without discipline, forecast accuracy decays quickly; with planning discipline applied every cycle, the decline is far gentler and the schedule stays useful for decision-making. Pair this with the calculators on PMMilestone — the SPI Calculator, CPI Calculator, Earned Schedule Calculator, Float Erosion Analyzer and Schedule Risk Monte Carlo — to watch your own accuracy curve in real time.
| Months of updates | With planning discipline | Unmanaged entropy |
|---|---|---|
| 0 | 100% | 100% |
| 2 | 96% | 88% |
| 4 | 92% | 74% |
| 6 | 88% | 60% |
| 9 | 83% | 45% |
| 12 | 78% | 32% |
Low-entropy vs high-entropy at a glance
If you want a one-page mental checklist to keep on the desk, this comparison is the version I hand to new planners in their first week.
| Attribute | Low-entropy schedule | High-entropy schedule |
|---|---|---|
| Logic | Complete, mostly FS, justified lags | Broken links, open ends, patch logic |
| Constraints | Few, and only where contractually real | Many hard constraints overriding logic |
| Critical path | Stable, tells an honest story | Jumps between updates |
| Progress | Applied in sequence | Frequent out-of-sequence progress |
| Float | Sensible, distributed | Negative or artificial float everywhere |
| Forecast finish | Reliable, defensible | Volatile, manually overridden |
| Stakeholder trust | High — numbers are believed | Low — numbers are questioned |
What actually increases entropy
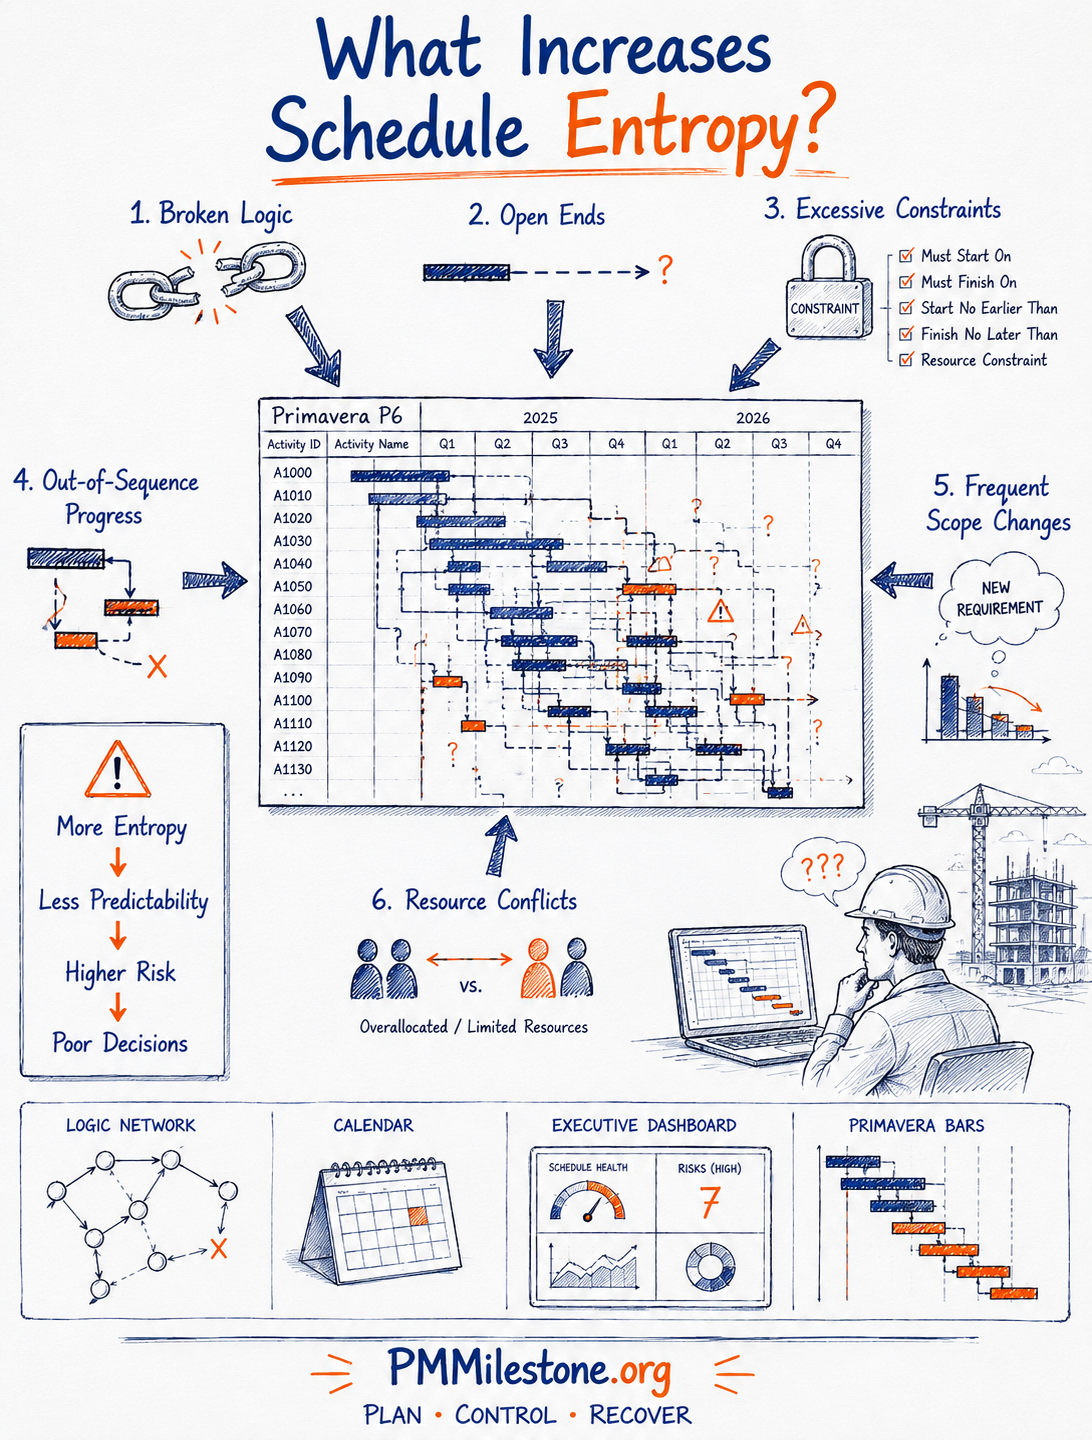
If entropy is the disease, these six habits are the accelerants. I've yet to see a chaotic schedule that wasn't driven by some combination of them.
1. Broken logic. A relationship deleted to make a report look better is a landmine. On a water-pipeline job, a planner removed a driving link so a milestone would show green for a board meeting. It worked — for one month. Then the true dependency reasserted itself and the milestone slipped six weeks in a single update. Broken logic doesn't remove risk; it hides it.
2. Open ends. Activities with no successor (or no predecessor) are dangling. They don't drive anything, so CPM calculates around them, and the total float they carry is meaningless. A DCMA-style check will flag these instantly. The fix is simple discipline: every activity except the true start and finish milestones should have a predecessor and a successor.
3. Excessive constraints. A constraint tells the schedule to ignore its own logic. One or two contractual dates are fine. Forty of them means the network is being driven by human overrides, not calculated dates — and the moment reality diverges from those constraints, your forecast is fiction. I treat every hard constraint as something I must be able to justify in a delay claim.
4. Out-of-sequence progress. When work is reported as done before its predecessor, the CPM engine has to make assumptions (retained or progress override), and the critical path becomes unstable. On a tunnelling package, out-of-sequence lining progress produced a critical path that swung between three completely different chains across three months. Nobody could plan resources against it.
5. Frequent scope changes. Every new requirement injected without proper re-logic is entropy waiting to happen. Change is inevitable on construction; the discipline is to fold it in cleanly — new activities, correct relationships, a re-baselined segment — rather than bolting it on with a constraint and a prayer. The Variation Order Impact Calculator and the Delay Claims Library help you cost that discipline.
6. Resource conflicts. Over-allocated crews and equipment create hidden delay that the dates don't yet show. If your tower crane is booked at 160% for a fortnight, one of those activities is going to slip — the schedule just doesn't know it yet. Resource-levelled schedules carry far less latent entropy.
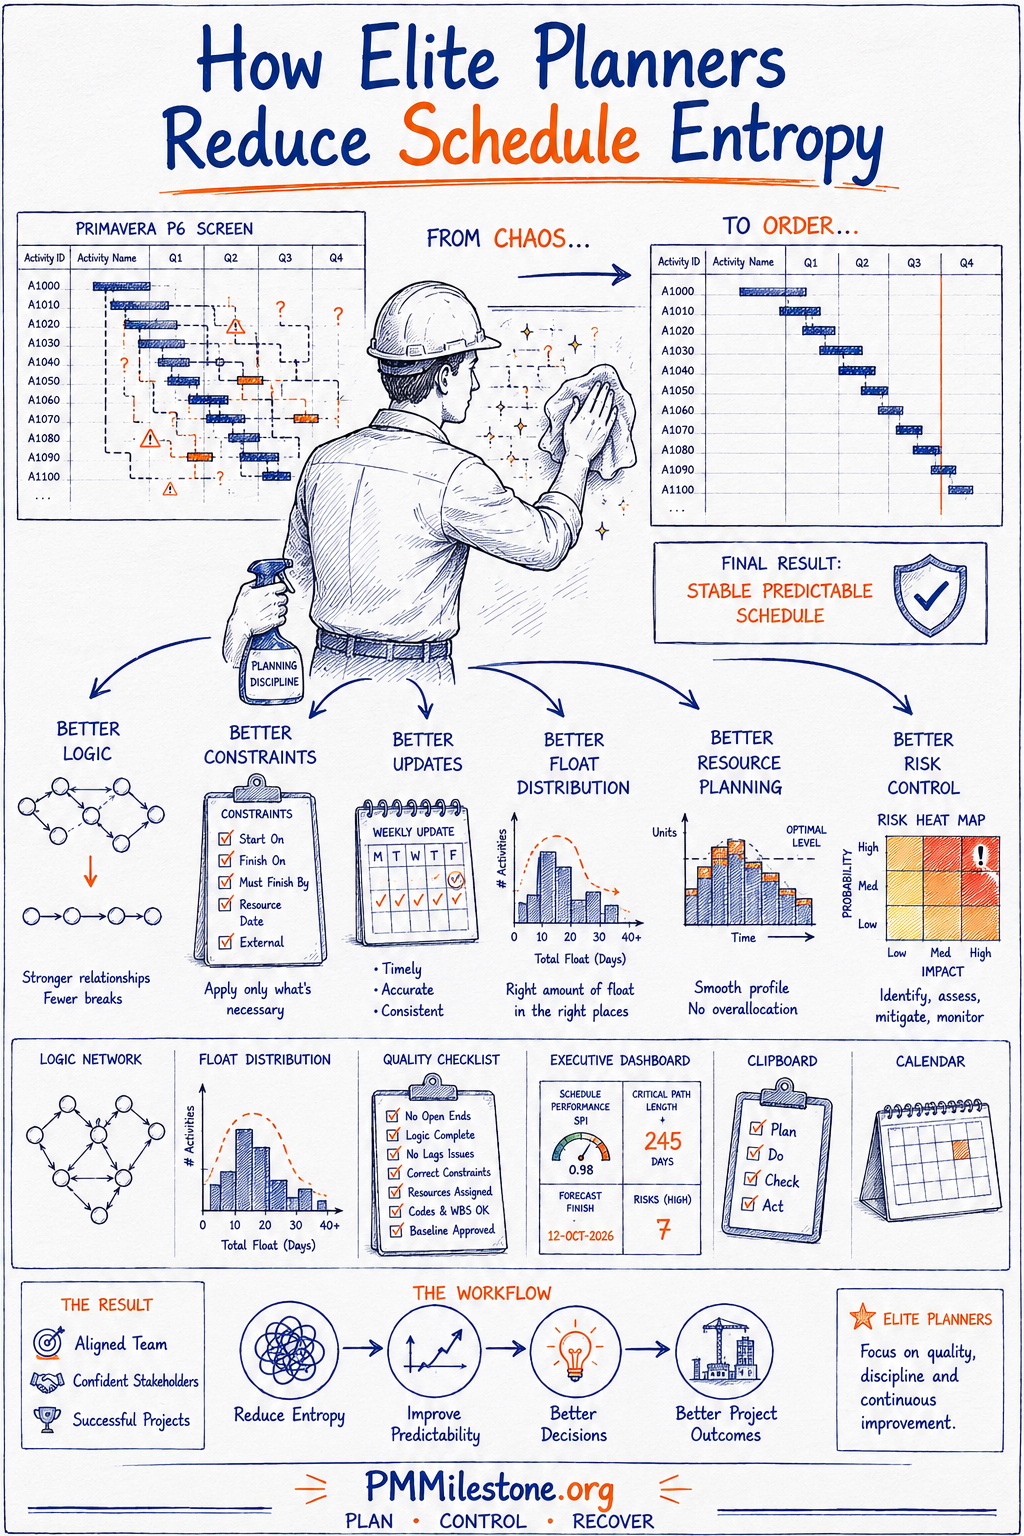
How elite planners reduce entropy
The good news is that entropy is reversible. The best planners I've worked with don't have magic tools — they have habits. They treat the schedule like a living asset that needs maintenance, and they apply small amounts of energy continuously rather than one heroic clean-up per year.
The single highest-leverage habit is the weekly logic audit — a fifteen-minute pass that checks for new open ends, freshly added constraints, out-of-sequence progress, and float outliers before they compound. It costs almost nothing and it is the closest thing our trade has to preventive maintenance. It sits alongside the disciplines taught in the First 5 Years roadmap and the PMO Reporting track.
| Discipline | What it looks like in practice | Entropy it prevents |
|---|---|---|
| Better logic | Complete network, mostly FS, no open ends | Broken links, open ends |
| Better constraints | Only contractually justified dates; documented rationale | Constraint-driven fiction |
| Better updates | Timely, accurate, consistent progress each cycle | Out-of-sequence drift |
| Better float | Float distributed sensibly, monitored for erosion | Hidden negative float |
| Better resourcing | Levelled crews and plant, no chronic over-allocation | Latent resource delay |
| Better risk control | Live risk register tied to schedule; heat-map reviewed | Blind spots, surprises |
Entropy is a measurable idea, not just a metaphor
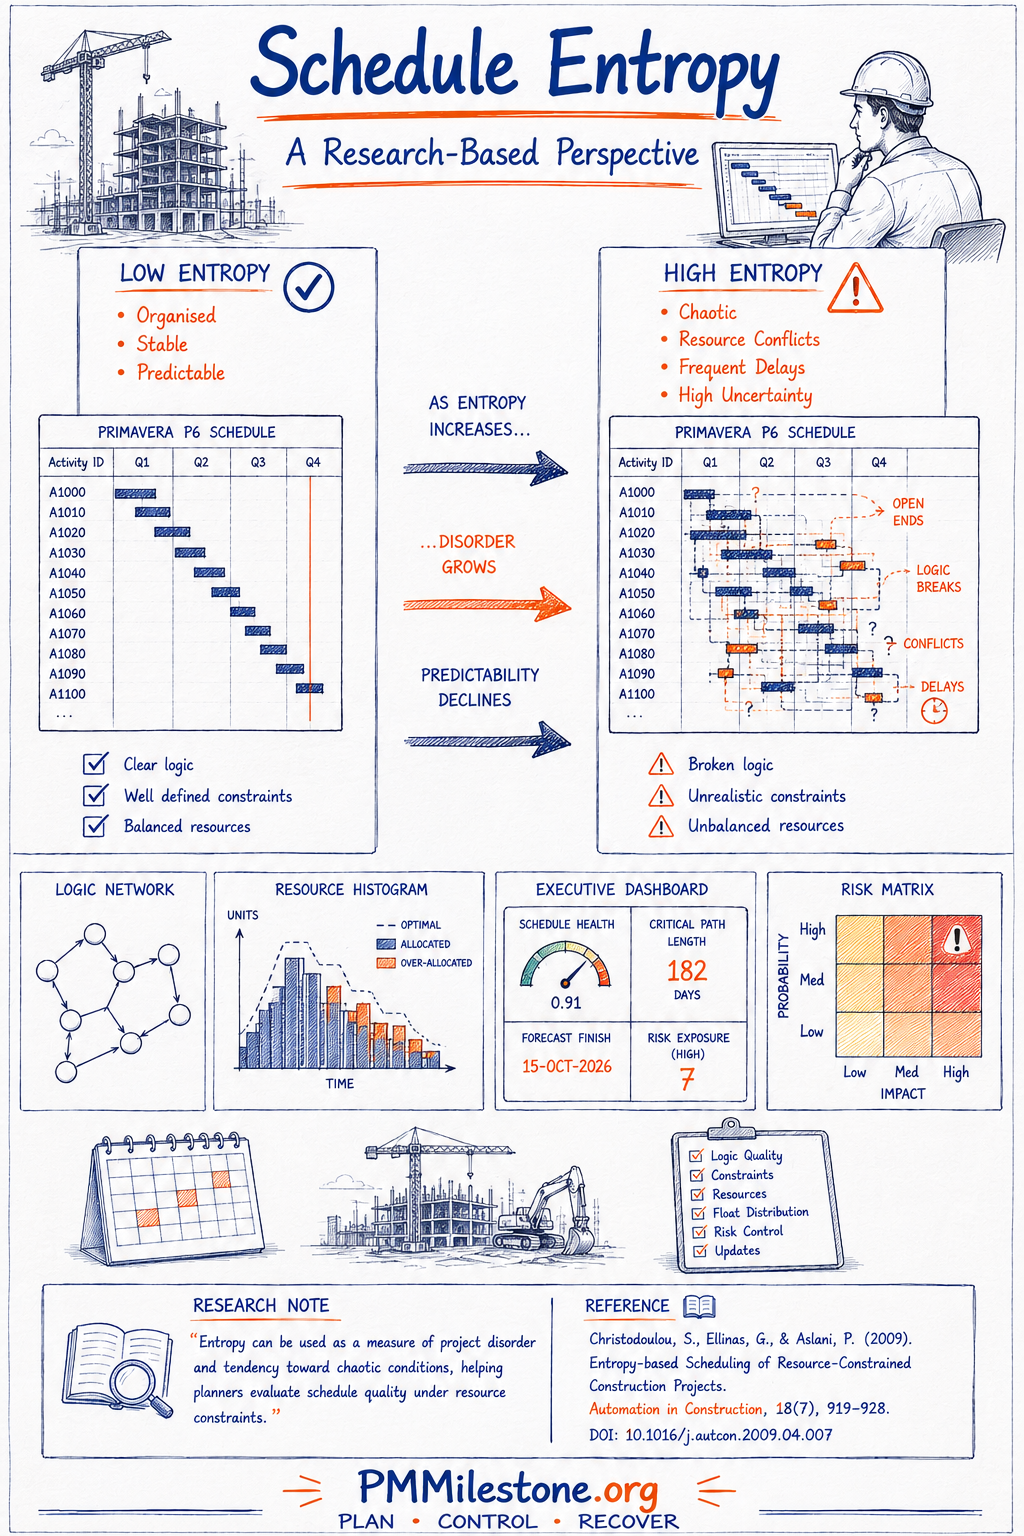
It would be easy to dismiss all this as a nice analogy. It isn't only that. There is genuine academic work treating entropy as a quantitative measure of schedule quality under resource constraints. Christodoulou, Ellinas and Aslani (2009) applied an entropy-based approach to resource-constrained construction scheduling, showing that the concept of disorder can be formalised and used to evaluate how orderly — or chaotic — a schedule really is.
The practical takeaway from that body of work is powerful: if disorder can be measured, it can be managed. You don't need to derive the mathematics to benefit from the mindset. Track the proxies you already have — number of constraints, count of open ends, out-of-sequence percentage, float distribution, SPI stability — and you have a serviceable entropy dashboard for your own programme. The Critical Path Risk Score and PM Health Score calculators are useful shortcuts.
Six ways planners quietly add entropy
If you want a quick self-audit, these are the small, well-intentioned habits that quietly break a schedule:
• Deleting a relationship instead of re-logic'ing it to make a report look green.
• Adding a hard constraint to force a milestone, with no documented justification.
• Applying progress out of sequence and ignoring the CPM warning flags.
• Letting activity counts balloon without ever pruning or rolling up detail.
• Treating resource over-allocation as "someone else's problem".
• Running the update but never auditing the logic afterwards.
A practical entropy scorecard for your own programme
You can start managing entropy on your next update cycle without buying anything or installing anything.
• Run a DCMA-style 14-point health check every month — it catches entropy early.
• Cap your hard constraints and keep a one-line justification for each in the notebook field.
• Watch the trend, not the snapshot: a forecast finish that moves every cycle is your entropy alarm.
• Re-baseline a segment cleanly after major change rather than patching the old logic.
• Keep a simple entropy scorecard: open ends, constraint count, out-of-sequence %, SPI stability.
For further reading, start at the PMMilestone Academy home, pick a Learning Track that matches your next twelve months, pair it with the relevant Knowledge Pillars, browse the Publications library, or read the methodology context on the Founder and About pages.
References
Christodoulou, S., Ellinas, G., & Aslani, P. (2009). Entropy-based Scheduling of Resource-Constrained Construction Projects. Automation in Construction, 18(7), 919–928. DOI: 10.1016/j.autcon.2009.04.007
Project Management Institute. (2021). A Guide to the Project Management Body of Knowledge (PMBOK® Guide) — Seventh Edition. Newtown Square, PA: PMI.
Defense Contract Management Agency (DCMA). (2012). 14-Point Schedule Assessment. Washington, DC: DCMA.
AACE International. (2011). Recommended Practice No. 49R-06: Identifying the Critical Path. Morgantown, WV: AACE International.
Uher, T. E., & Zantis, A. S. (2011). Programming and Scheduling Techniques (2nd ed.). Sydney: UNSW Press.
Frequently asked questions
Is schedule entropy a real technical term or just an analogy?
Both. In everyday planning it's a powerful analogy, but there is peer-reviewed research — notably Christodoulou et al. (2009) — that treats entropy as a genuine quantitative measure of schedule disorder under resource constraints.
How do I know if my schedule already has high entropy?
The clearest signal is an unstable forecast finish — a date that moves every update for no clear reason. Supporting symptoms include a jumping critical path, a rising constraint count, open ends, and frequent out-of-sequence progress.
Can I measure entropy without complex mathematics?
Yes. Use practical proxies you already have in P6: number of open ends, number of hard constraints, percentage of activities progressing out of sequence, float distribution, and SPI stability across periods. Together they form a serviceable entropy scorecard.
What is the single best habit for keeping entropy low?
A short weekly logic audit. Fifteen minutes checking for new open ends, new constraints, out-of-sequence progress, and float outliers prevents the small edits that compound into chaos.
Does adding more detail always increase entropy?
No — appropriate detail improves accuracy. Entropy rises only when detail grows faster than logic quality can keep up. The goal is the right detail with clean relationships, not the most activities.
Next steps on PMMilestone
Use these pages to deepen the topic, verify terminology, compare real cases and move from theory into applied project controls practice.
Related calculators
Open the calculators referenced in this article and run them against your own project numbers.
SPI Calculator
Schedule Performance Index — measure schedule efficiency.
Open Earned ValueCPI Calculator
Cost Performance Index — measure cost efficiency.
Open ScheduleEarned Schedule Calculator
Time-based schedule performance (SPI(t)).
Open ScheduleFloat Erosion Analyzer
Track total float consumed on critical paths.
Open ScheduleCritical Path Risk Score
Score the fragility of your critical path.
Open ScheduleSchedule Compression Calculator
Cost per day of crashing the schedule.
Open ConstructionVariation Order Impact Calculator
Variation value as % of contract.
Open ReportingPM Health Score
Composite project health score 0–100.
OpenOther learning tracks
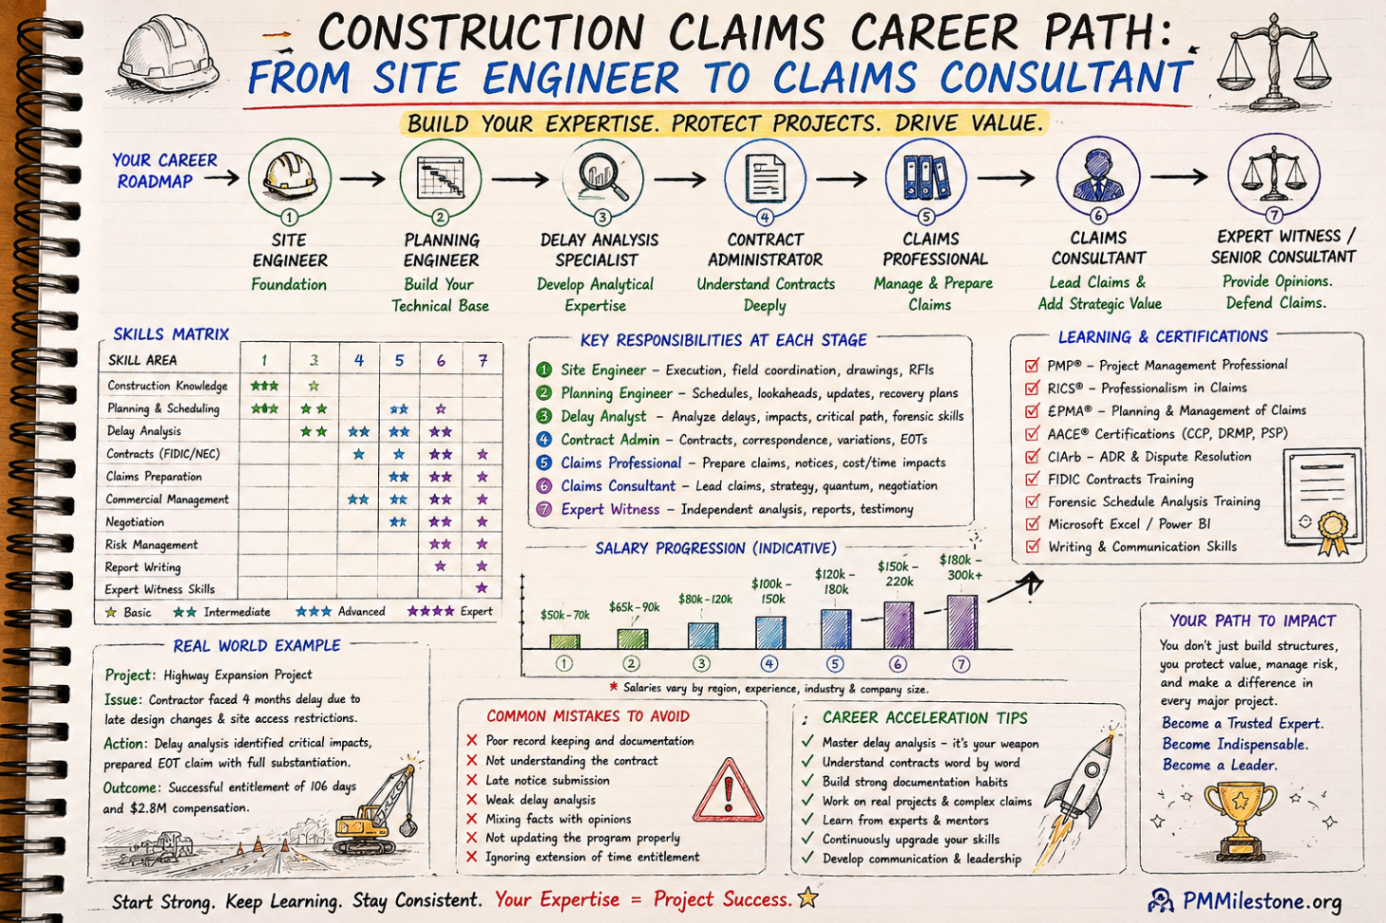
Construction Claims Career Path
A practical roadmap for engineers moving from site delivery into planning, delay analysis, claims, commercial controls and senior claims consulting.
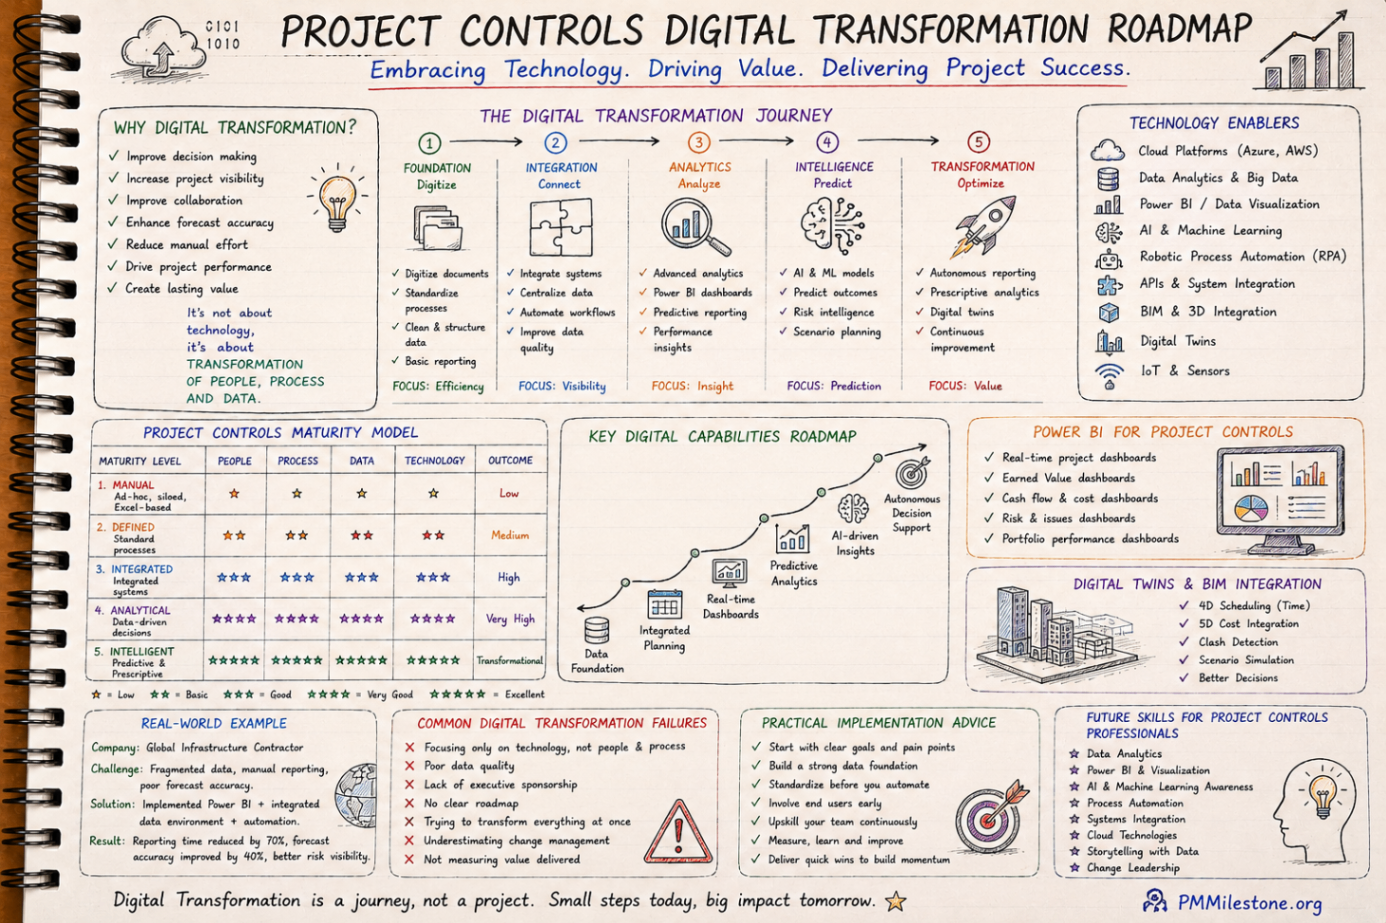
Project Controls Digital Transformation Roadmap
A future-focused guide to modern project controls through data integration, reporting automation, Power BI, AI, BIM and digital PMO capability building.
Project Controls Fundamentals
Scope, schedule, cost, risk, quality and reporting — the six disciplines that hold every successful capital project together, taught from first principles.