Project Controls KPIs Explained: The Metrics That Actually Matter

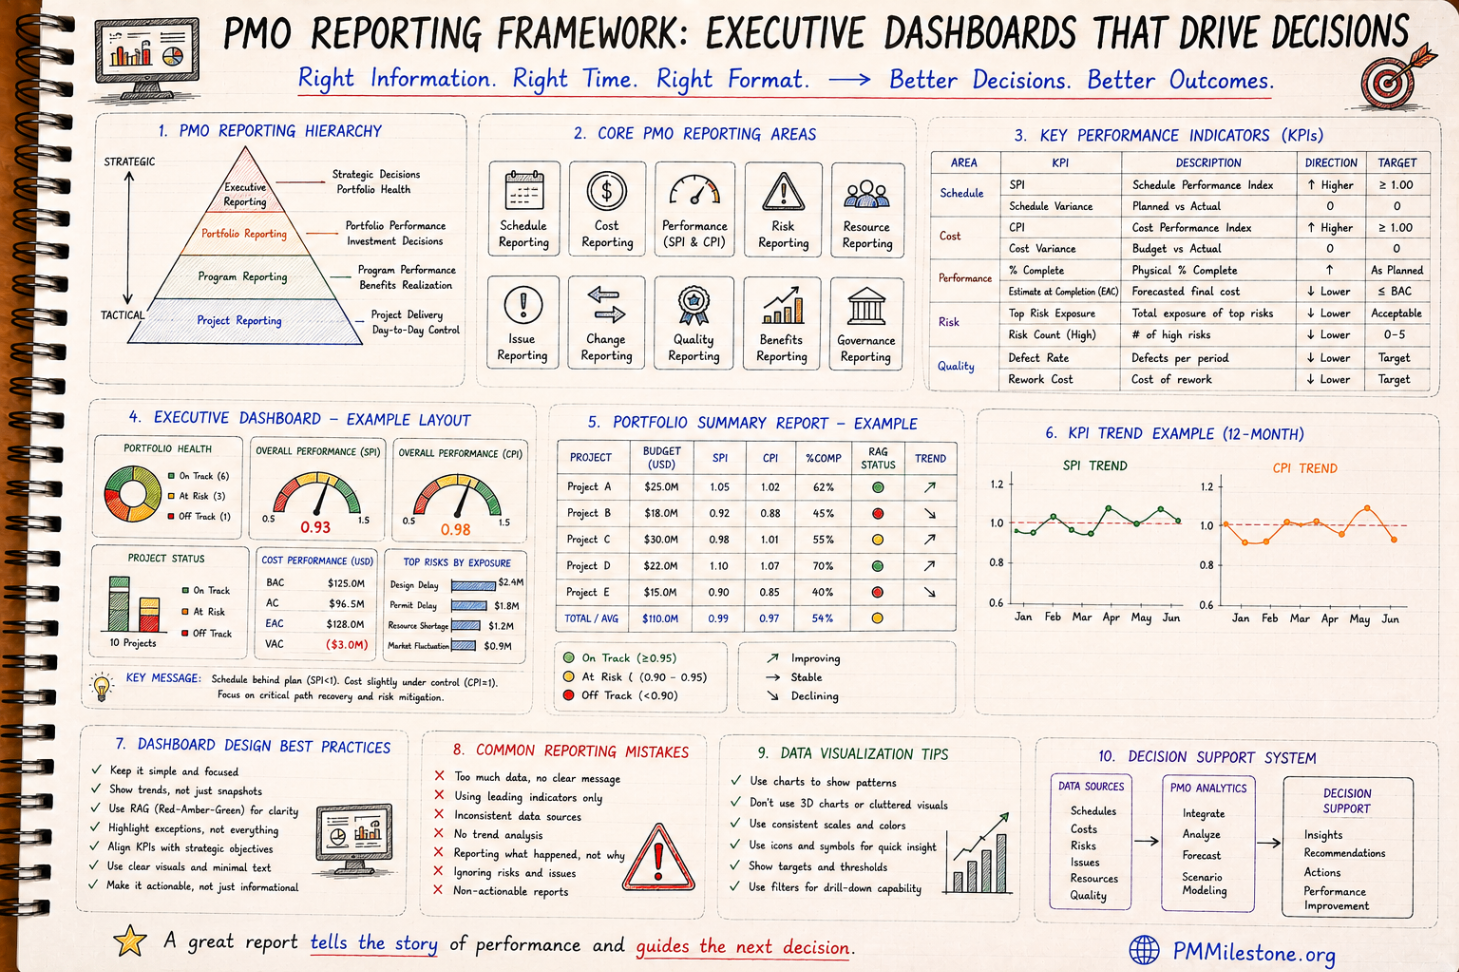
Why most KPI dashboards fail
Most project dashboards fail for the same reason: they measure what is easy to count rather than what changes decisions. Forty tiles of activity metrics, all green, on a project that is quietly nine months from a crisis — every experienced project controls professional has seen that dashboard. The problem is rarely missing data; it is missing selection, missing thresholds and missing trend.
A KPI earns its place on a report by passing three tests. It must connect to an outcome someone is accountable for. It must have a threshold that triggers a defined response when crossed. And it must be shown as a trend, because in project controls the direction and rate of change almost always carry more information than the current value. A CPI of 0.97 holding steady for six months and a CPI of 0.97 falling from 1.05 over three months are entirely different situations — and a value-only dashboard cannot tell them apart.
This pillar works through the metrics that actually matter, level by level: the core earned value indices, the variances, the forecast indicators, schedule health, field productivity and the PMO layer. Definitions follow the standard usage in the Project Controls Glossary, and the underlying mechanics are covered in the Complete EVM Framework pillar.
The core efficiency indices: SPI and CPI
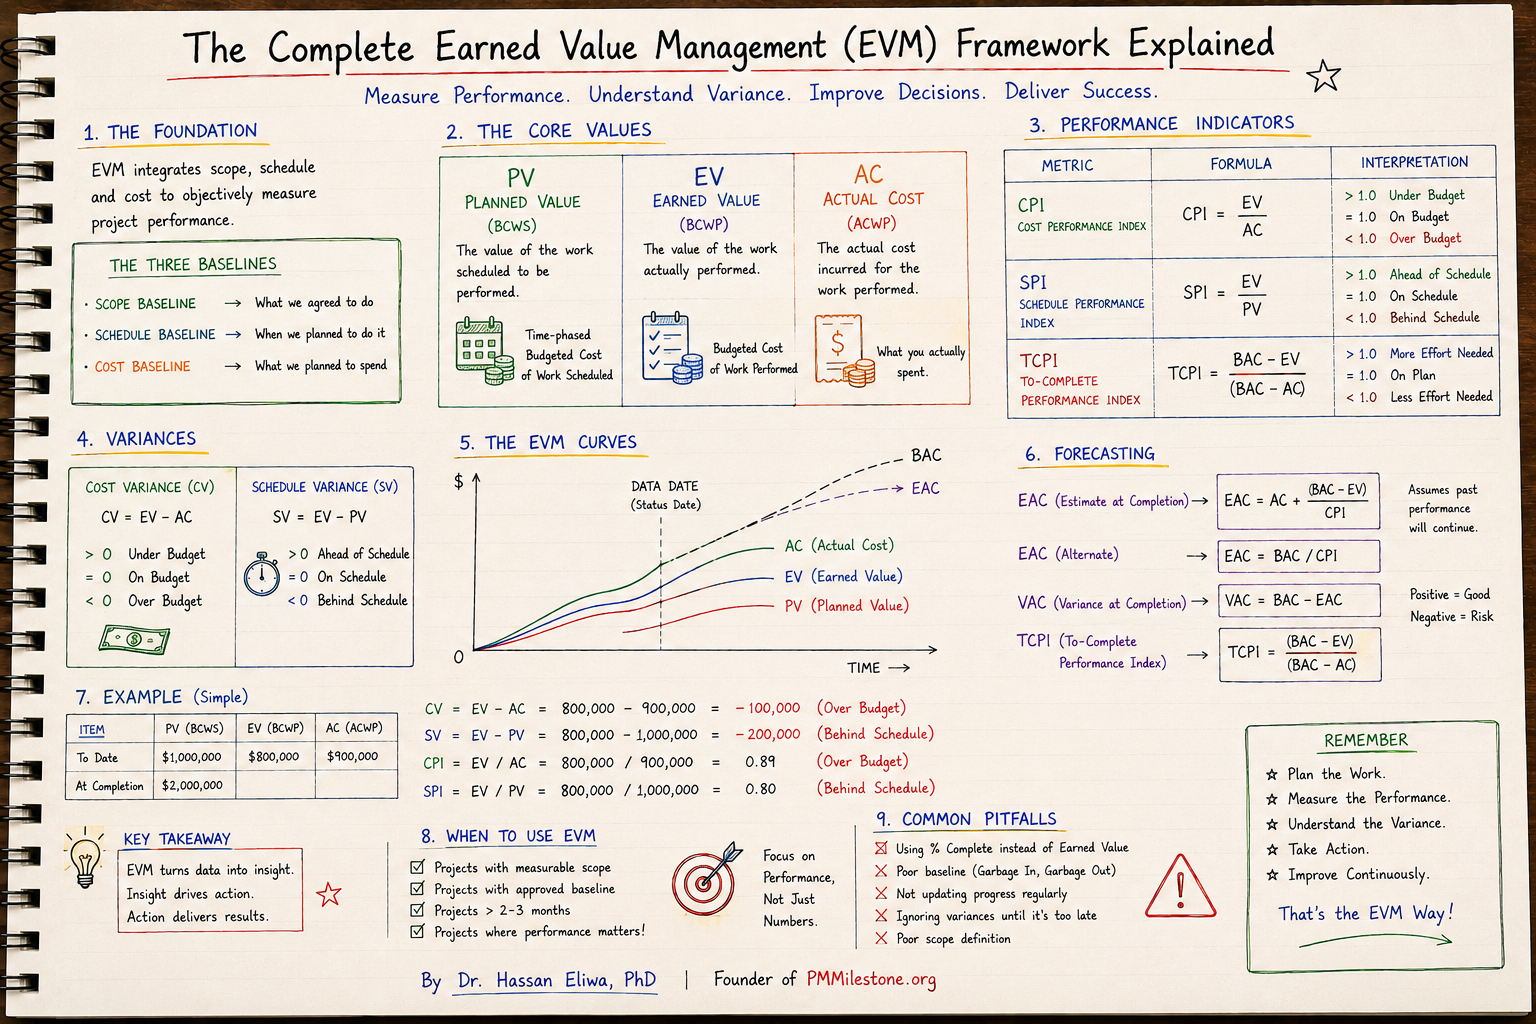
The Schedule Performance Index (SPI = EV ÷ PV) and the Cost Performance Index (CPI = EV ÷ AC) are the two most quoted numbers in project controls, and the two most misread. SPI measures the rate of earning value against plan; CPI measures the cost efficiency of the value earned. Both are ratios around 1.0 — above is favourable, below is unfavourable — and both must be read with their known blind spots in mind.
SPI's blind spot is the end of the project: as remaining planned value approaches zero, SPI converges to 1.0 regardless of how late the project is, which is why earned schedule analysis exists. SPI is also volume-weighted, so strong performance on non-critical work can mask a slipping critical path. CPI's blind spot is stability: research across defence and capital programmes shows the cumulative CPI rarely improves materially after the 20% completion point — a project at 30% complete with a CPI of 0.90 should be forecasting from that reality, not hoping past it.
Build intuition with the SPI Calculator and the CPI Calculator, then make a habit of reading both indices together: CPI below 1.0 with SPI above 1.0 often signals buying schedule with money, and the reverse often signals slowing down to protect cost.
Variances: SV, CV and what they hide
Schedule Variance (SV = EV − PV) and Cost Variance (CV = EV − AC) express the same performance facts as the indices, but in currency. Their value is communication: a board understands "$14M of planned work not yet earned" faster than an index of 0.93. Their danger is aggregation — a programme-level CV of zero can conceal a $20M overrun in civils cancelled out by a $20M underrun caused by late procurement that will cost more later.
Always decompose variances to control-account level before drawing conclusions, and distinguish timing variances (work shifted between periods) from performance variances (work genuinely costing more or earning slower). The SV Calculator and CV Calculator cover the arithmetic; the judgement is in the decomposition.
Forecast KPIs: EAC, ETC, VAC and TCPI
Performance indices describe the past; forecast KPIs describe where the project will land. The Estimate at Completion (EAC) is the headline, the Estimate to Complete (ETC) is the forward-looking cost of remaining work, the Variance at Completion (VAC = BAC − EAC) expresses the gap to budget, and the To Complete Performance Index (TCPI) asks the hardest question on the page: what efficiency would the remaining work need to achieve for the target to hold?
TCPI deserves special attention as an early warning metric. When TCPI exceeds the current CPI by more than roughly 0.10, the project is implicitly claiming it will perform significantly better in the future than it ever has in the past — a claim that should be challenged with evidence, not accepted with hope. Test scenarios with the EAC Calculator, ETC Calculator, VAC Calculator and TCPI Calculator, and see the Project Forecasting Guide for the full method family.
| KPI | Formula | What it tells you |
|---|---|---|
| SPI | EV ÷ PV | Rate of earning against plan (volume, not path) |
| CPI | EV ÷ AC | Cost efficiency of work performed |
| SV / CV | EV − PV / EV − AC | The same facts in currency, for communication |
| EAC | e.g. BAC ÷ CPI | Forecast final cost under stated assumptions |
| ETC | EAC − AC | Cost of the remaining work from today |
| VAC | BAC − EAC | Forecast gap to budget at completion |
| TCPI | (BAC − EV) ÷ (BAC − AC) | Efficiency required on remaining work to hit target |
Schedule health KPIs beyond SPI
Because SPI cannot see the critical path, mature programmes pair it with structural schedule health metrics: total float consumption on the critical and near-critical paths, the count of activities with negative float, baseline execution index (activities completed versus baselined to complete), logic quality indicators, and earned schedule measures that express schedule performance in time units rather than value units.
Float erosion is the most decision-relevant of these. A critical path that loses float steadily for three consecutive updates is announcing a slip months before the completion date moves. Track it with the Float Erosion Analyzer, score structural exposure with the Critical Path Risk Score, and convert schedule performance into time terms with the Earned Schedule Calculator.
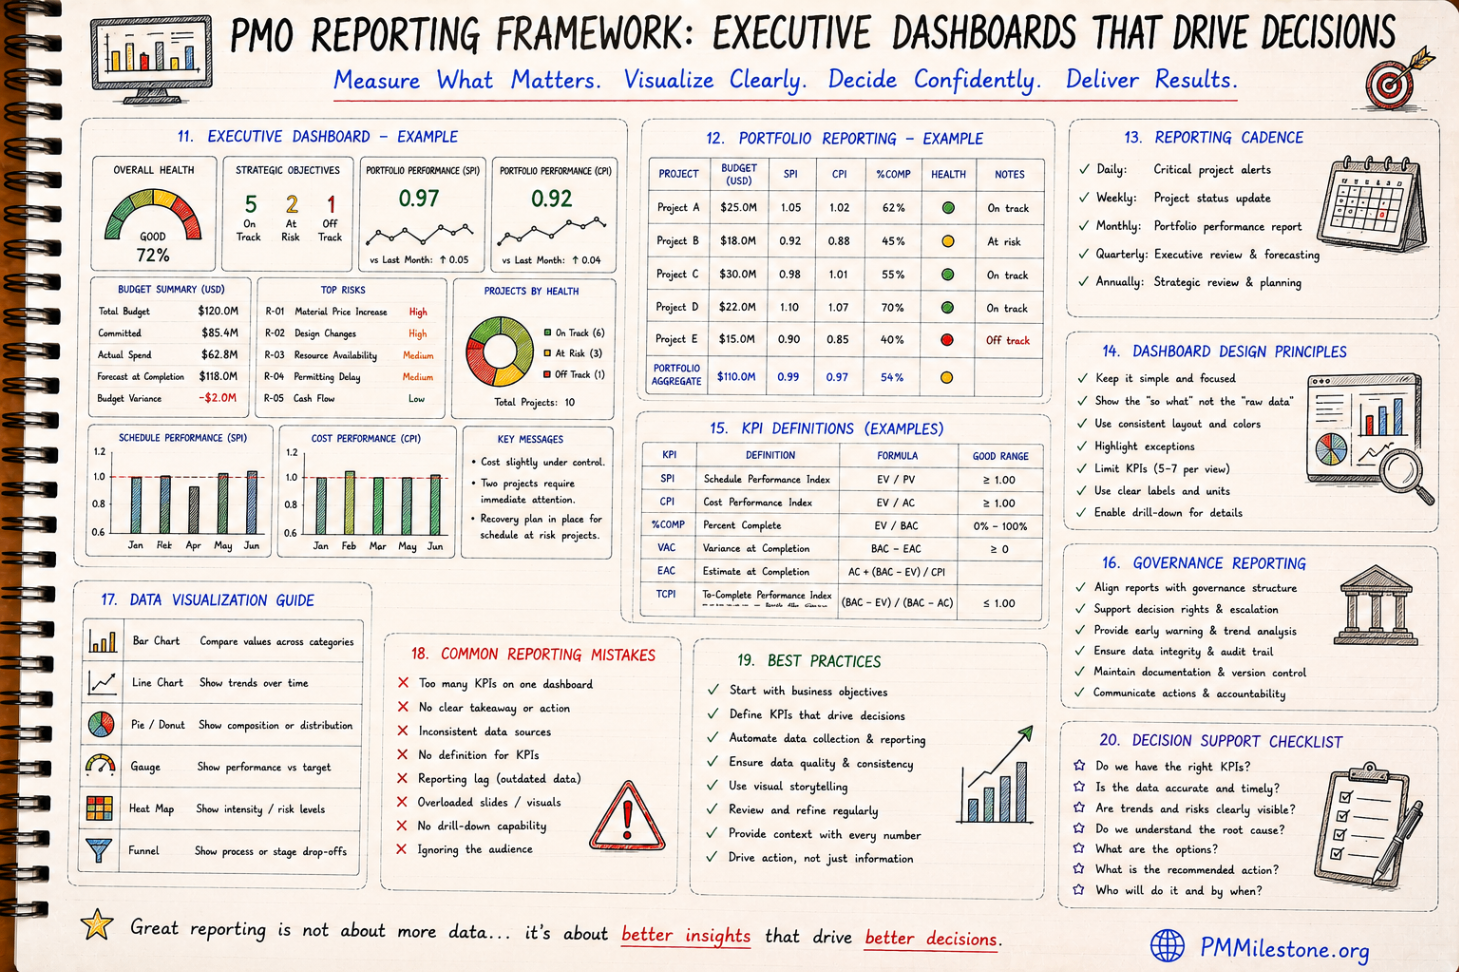
Productivity and field KPIs
On construction-heavy projects, earned value indices lag the field by weeks. Field productivity KPIs lead them: actual versus budgeted unit rates (hours per cubic metre of concrete, per tonne of steel, per metre of cable), the productivity factor (earned hours ÷ expended hours), and disruption indicators such as overtime ratio, crew stacking and rework percentage. A productivity factor deteriorating at the work front shows up in CPI a month later and in the EAC a quarter later — the field number is the early warning.
These metrics also carry commercial weight: measured-mile productivity comparisons are the backbone of disruption claims. Run the numbers with the Construction Productivity Calculator and the Labour Efficiency Calculator, and see the Construction Productivity pillar for the full management system around them.
The reporting discipline for productivity KPIs is granularity: track them per work front and per trade, not as a project average. A project-level productivity factor of 0.95 is uninformative when the piping crews are running at 1.10 and the electrical crews at 0.75 — the average hides exactly the signal the metric exists to provide, and the disruption affecting one trade will spread to its successors before an aggregate number ever moves.
PMO and portfolio KPIs
At PMO level the KPI set changes character: the question is no longer "how is this project performing?" but "which projects need attention, and is the portfolio deliverable?". The core set includes the distribution of CPI/SPI across the portfolio, forecast accuracy (how much EACs moved over the last four quarters — a direct measure of forecasting honesty), contingency drawdown versus progress, change velocity, milestone hit rate and risk exposure trend.
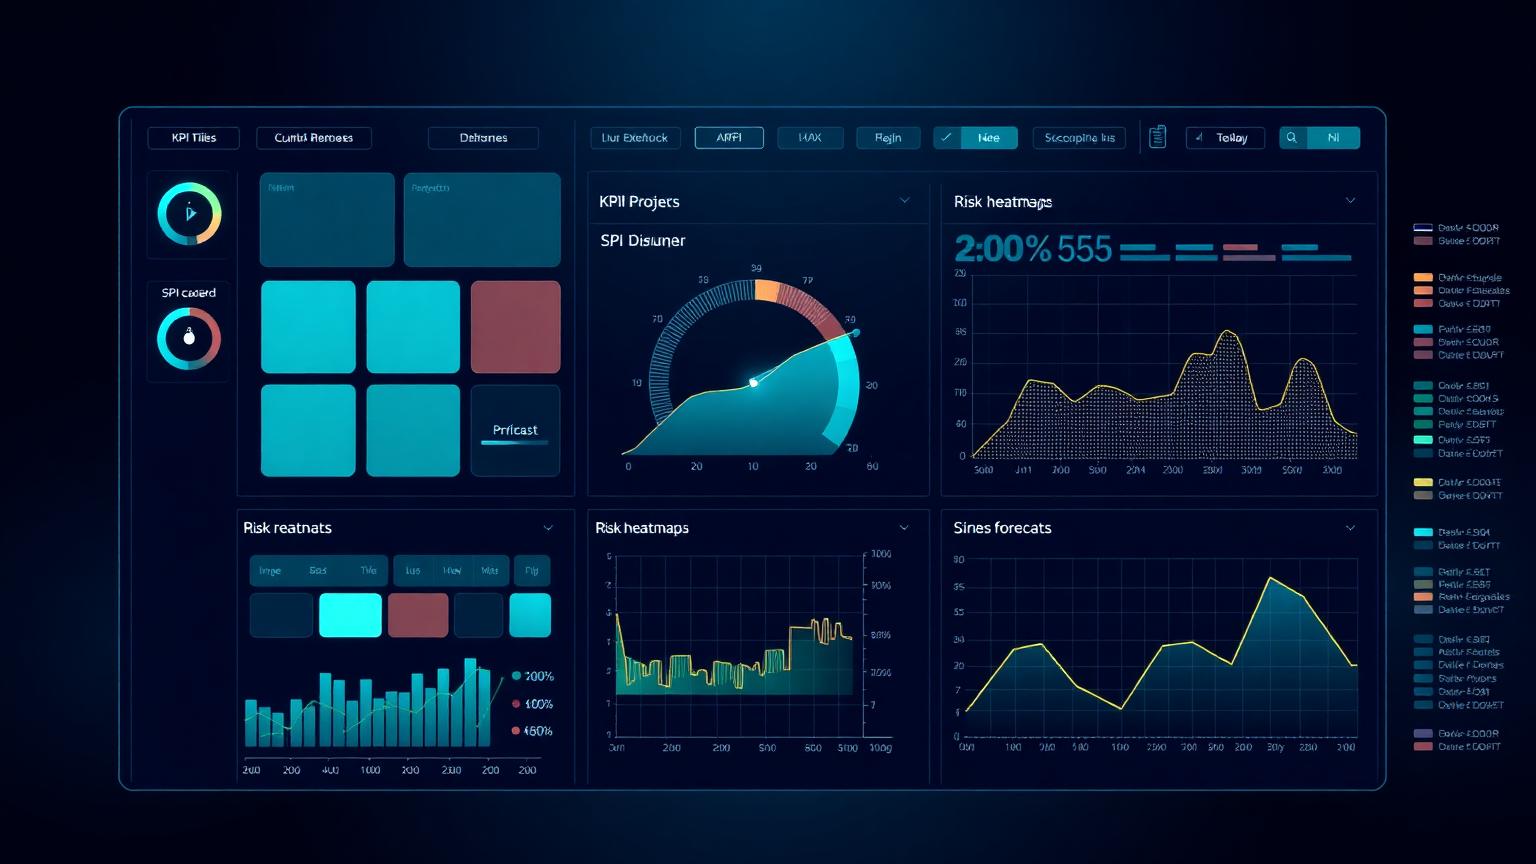
Comparability is the discipline that makes portfolio KPIs meaningful: every project must measure progress, earn value and report on the same rules, or the portfolio view becomes a comparison of reporting styles rather than performance. Assemble a top-level set with the Executive KPI Dashboard, score portfolio condition with the Portfolio Health Index, and design the reporting around it with the PMO Reporting & Executive Dashboards pillar.
Thresholds and traffic lights done properly
Traffic-light reporting fails when the thresholds are undefined, negotiable or applied to values instead of trends. Done properly, each KPI carries a published threshold pair (amber and red), the rating is mechanical rather than discretionary, and crossing a threshold triggers a defined response — a variance analysis, a recovery plan, an escalation — within a defined time. The table below is a defensible starting point for capital projects; calibrate to contract type and risk appetite, then stop negotiating the colours.
| KPI | Green | Amber | Red |
|---|---|---|---|
| CPI (cumulative) | ≥ 0.97 | 0.90 – 0.97 | < 0.90 or falling 3 periods |
| SPI (cumulative) | ≥ 0.95 | 0.88 – 0.95 | < 0.88 or critical path slipping |
| TCPI − CPI gap | ≤ 0.05 | 0.05 – 0.10 | > 0.10 (target not credible) |
| VAC ÷ BAC | ≥ −2% | −2% to −5% | Worse than −5% |
| Critical path float | Stable | Eroding 2 updates | Negative or eroding 3+ updates |
| Contingency drawdown | ≤ % complete | Tracking ahead ≤ 10pts | Ahead > 10pts of progress |
Selecting the KPI set: fewer, harder, trended
The selection rules are short. Keep the executive set under ten — every metric added past that point subtracts attention from the ones that matter. Cover all four dimensions: past performance (CPI, SPI), forward outlook (EAC range, TCPI), structural health (float, change velocity) and exposure (risk trend, contingency). Show every KPI as a trend with its threshold drawn on the chart. Pair each with an owner and a defined response. And resist vanity metrics — percent of reports submitted on time is a PMO activity measure, not a project performance measure.
Above all, protect the integrity of the inputs. A KPI system built on subjective percent complete, unprotected baselines or inconsistent progress rules produces precise-looking nonsense. The KPI layer is only as honest as the integrated controls framework beneath it — covered in depth in the Integrated Project Controls Framework pillar.
KPI governance: keeping the numbers honest
Every KPI system degrades under pressure unless governance protects it. The known failure patterns are documented across the Mega Project Case Studies and the Project Failure Database: progress rules quietly relaxed to lift EV, re-baselining used to reset embarrassing variances, thresholds renegotiated when crossed, and EACs anchored back toward budget month after month until reality arrives all at once. Each is a measurement integrity failure before it is a delivery failure.
The countermeasures are structural: progress measurement rules fixed in writing and audited, baselines changed only through formal change control, thresholds published and non-negotiable, forecast movements explained against last period, and an assurance route that lets the controls function report bad news without filtering. Teams that learn to read KPIs as evidence — and protect them as evidence — make better decisions for the life of the programme. For the research base behind these practices, see the Publications library, and continue in the PMMilestone Academy through the Learning Tracks and Knowledge Pillars for the disciplines each KPI depends on.
Frequently asked questions
What are the most important KPIs in project controls?
For a single project: cumulative CPI and SPI read as trends, an EAC range with its movement since last period, the TCPI-to-CPI gap, critical path float erosion and contingency drawdown versus progress. Together they cover past performance, forward outlook, structural health and exposure in under ten metrics.
What is a good CPI or SPI value?
Both indices centre on 1.0, with above 1.0 favourable. In practice, cumulative values at or above roughly 0.97 for CPI and 0.95 for SPI are healthy on capital projects; sustained values below 0.90 indicate serious performance problems. The trend matters more than the value — a falling index from a healthy level deserves more attention than a stable index slightly below target.
Why is TCPI considered such a strong early warning indicator?
Because it converts a cost target into a required future efficiency and lets you compare it with demonstrated efficiency. When TCPI exceeds the current CPI by more than about 0.10, the project is implicitly promising to perform far better than it ever has — historically an unreliable promise, given that cumulative CPI rarely improves materially after 20% completion.
How many KPIs should an executive project dashboard contain?
Fewer than ten. Executive dashboards exist to direct attention and trigger decisions, not to summarise the database. Each KPI should carry a trend, a published threshold, an owner and a defined response when the threshold is crossed; anything that fails those tests belongs in an appendix.
Why do SPI and SV become unreliable near the end of a project?
Both compare earned value to planned value, and as remaining planned value approaches zero the comparison compresses: SPI converges to 1.0 and SV to zero regardless of lateness. Earned schedule analysis solves this by measuring performance in time units, which is why mature programmes report it alongside SPI in the final third of execution.
Academy articles that build on this pillar
These newer Academy articles reference this Knowledge Pillar directly — continue with them to apply the concepts.
Where this article connects
Curated cross-links: related Academy articles, the Knowledge Pillars this topic draws on, and the calculators referenced in the FAQs above.
Related Academy articles
Relevant Knowledge Pillars
Related learning for this topic
Hand-picked Learning Tracks, Knowledge Pillars, publications and case data that extend this article.
Next steps on PMMilestone
Use these pages to deepen the topic, verify terminology, compare real cases and move from theory into applied project controls practice.
Related calculators
Open the calculators referenced in this article and run them against your own project numbers.
SPI Calculator
Schedule Performance Index — measure schedule efficiency.
Open Earned ValueCPI Calculator
Cost Performance Index — measure cost efficiency.
Open Earned ValueSchedule Variance (SV) Calculator
Measure schedule variance in dollars.
Open Earned ValueCost Variance (CV) Calculator
Measure cost variance in dollars.
Open ForecastingVAC Calculator
Variance at Completion forecast.
Open ForecastingTCPI Calculator
To-Complete Performance Index — required efficiency to finish on budget.
OpenOther knowledge pillars
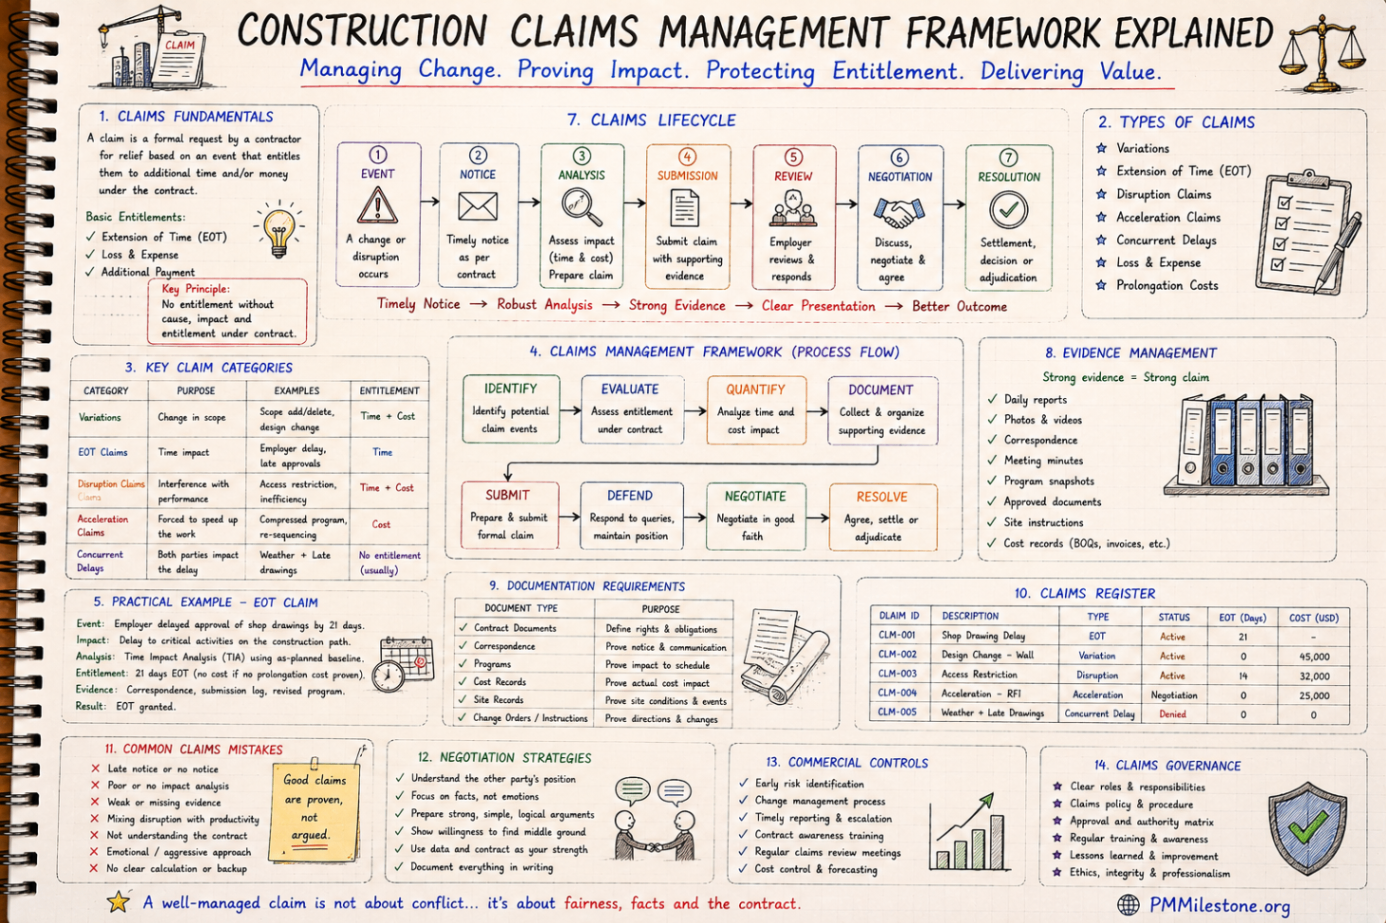
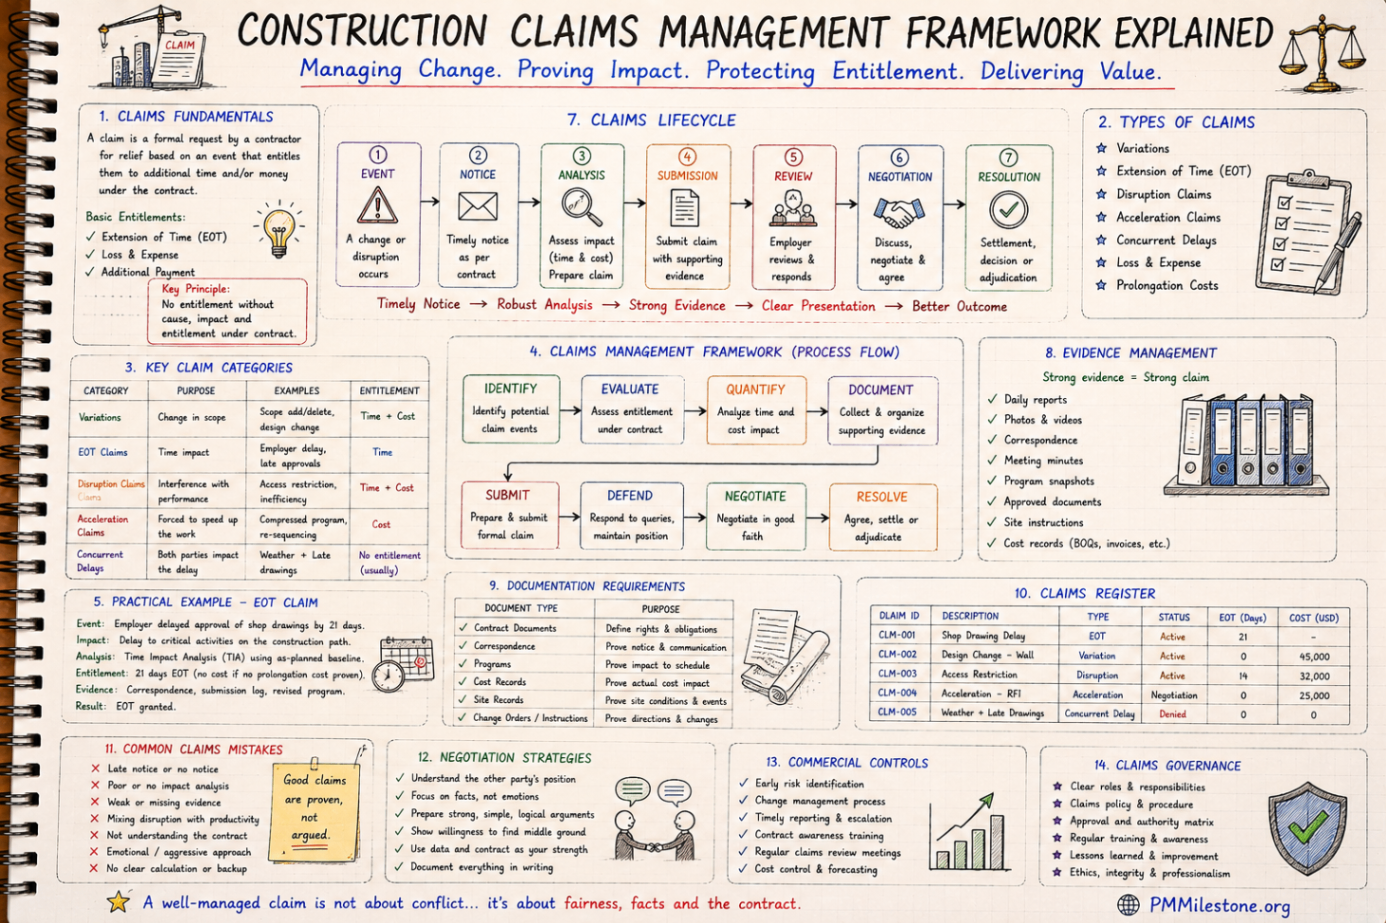
Construction Claims Management Framework Explained
A practical claims management framework for construction and infrastructure projects covering entitlement, records, analysis, negotiation and governance.
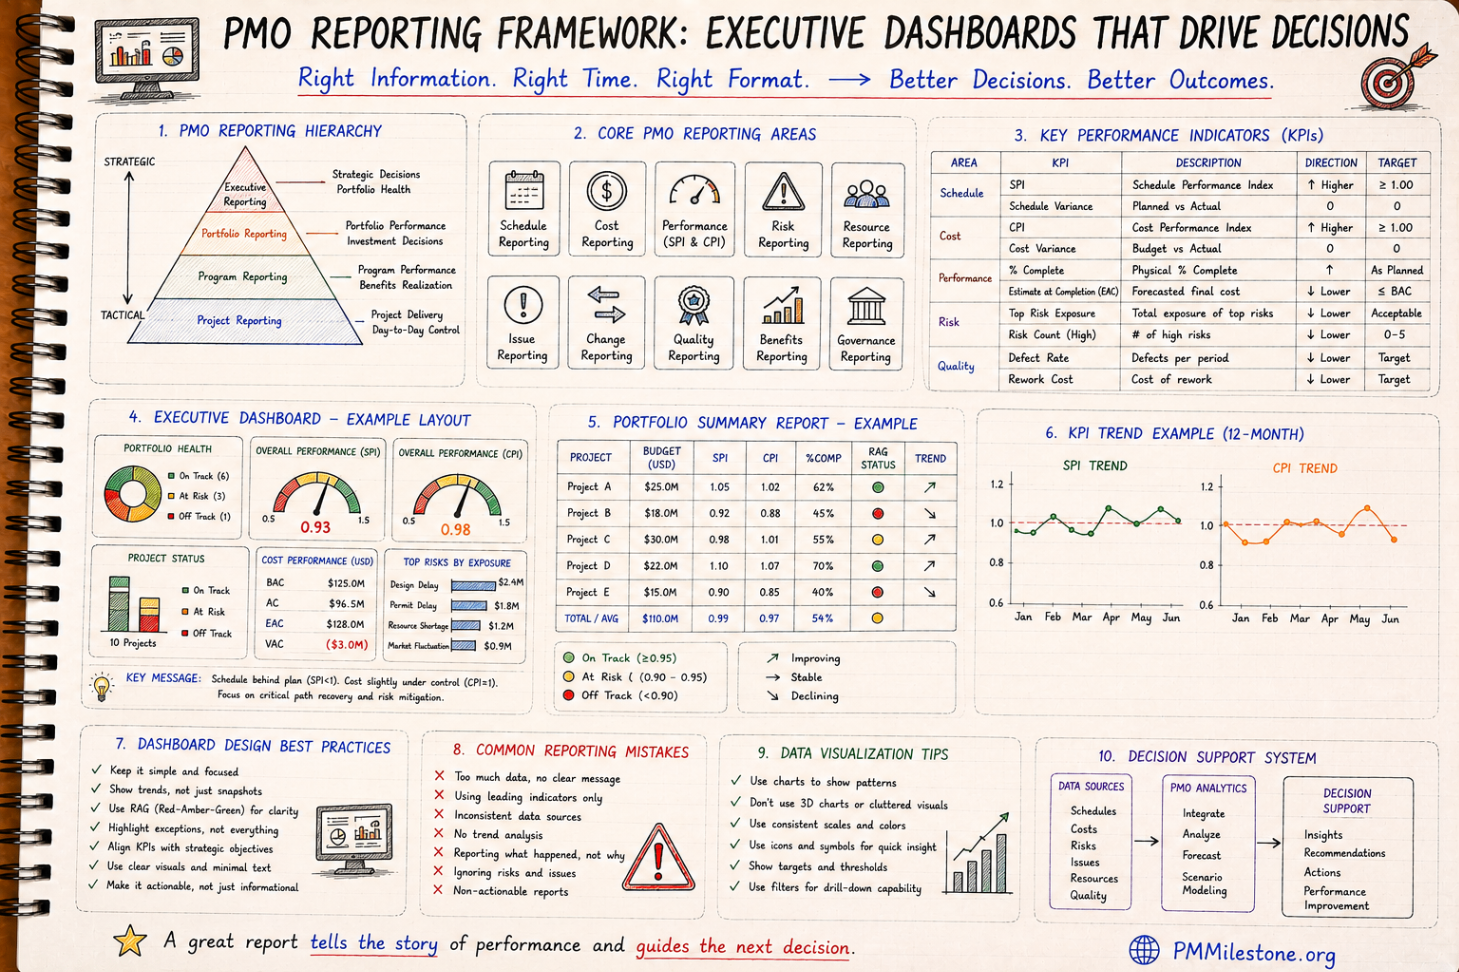
PMO Reporting Framework
A reference guide to executive PMO reporting covering dashboard structure, KPI choice, portfolio views, reporting cadence and common reporting mistakes.

Guides and Long-Form Articles
Practitioner-written explainers across EVM, planning, forecasting, risk and PMO design — read as a syllabus or as a refresher.