DCMA 14-Point Assessment in Primavera P6: What Each Check Really Means and How to Fix Failures (2026 Field Guide)


The first time a client rejected one of my schedules on "DCMA grounds", the cover email was two lines long and the attachment was a scorecard with six red cells. No markups, no comments on sequencing, no questions about the construction strategy. Just six percentages that were higher than five.
What stung was that the programme was, in my view, a good one. The logic reflected how the job would actually be built, and the critical path ran exactly where the superintendent said it would. But the scorecard did not care about any of that, and in fairness, the reviewer had forty schedules to get through that month. The scorecard was the quickest way to decide which ones deserved a closer look.
That is the reality of the DCMA 14-point assessment in 2026. It started life as a Defense Contract Management Agency tool for reviewing contractor schedules on US defence programmes, and it has since become the default first filter used by owners, PMCs, lenders' engineers and forensic reviewers well outside defence: hospitals, metro lines, oil and gas, data centres. Schedule analysis software runs it in seconds, and a growing number of AI schedule checkers now produce a DCMA score before a human has opened the file.
So you need to pass it. But more importantly, you need to understand it, because a schedule that passes for the wrong reasons is worse than one that fails honestly. This guide walks through what each check really measures, how it maps to Primavera P6, how to fix the common failures properly, and where the assessment can mislead you.
By Dr. Hassan Eliwa, PhD, Founder of PMMilestone.org. Explore his research and publications.
What the DCMA 14-point assessment actually is (and is not)
The assessment is a set of fourteen metrics that test whether a CPM schedule is built and statused in a way that makes its dates believable. It does not tell you whether the sequence is sensible, whether the durations are realistic or whether the contractor can actually build the job in that order. It tells you whether the schedule is structurally capable of producing a reliable forecast.
The single most useful sentence I can offer on this topic comes from the US Government Accountability Office's schedule guidance, describing DCMA's own position: the 14-point thresholds "are not compliance triggers" but a starting point toward an objective analysis of the schedule. In other words, a red cell is a question, not a verdict.
That framing changes how you respond to a scorecard. If you treat the thresholds as a pass mark, you will spend your time massaging numbers. If you treat them as questions, you will spend your time answering them, and most reviewers are perfectly happy with a schedule that shows 7% lags provided each one is explained and genuinely represents a physical wait.
The 14 checks at a glance
| # | Check | What it measures | Commonly applied threshold | Group |
|---|---|---|---|---|
| 1 | Logic | Incomplete activities missing a predecessor or successor | ≤ 5% | Network integrity |
| 2 | Leads | Relationships with negative lag | 0 | Network integrity |
| 3 | Lags | Relationships with positive lag | ≤ 5% | Network integrity |
| 4 | Relationship types | Share of Finish-to-Start links | ≥ 90% FS | Network integrity |
| 5 | Hard constraints | Activities with constraints that override logic | ≤ 5% | Network integrity |
| 6 | High float | Incomplete activities with total float > 44 working days | ≤ 5% | Float & duration |
| 7 | Negative float | Incomplete activities with total float < 0 | 0 (or explained with a recovery plan) | Float & duration |
| 8 | High duration | Incomplete activities with baseline duration > 44 working days | ≤ 5% | Float & duration |
| 9 | Invalid dates | Actuals after the data date or forecasts before it | 0 | Status integrity |
| 10 | Resources | Activities without resources or cost loaded | Reported; contract-dependent | Status integrity |
| 11 | Missed tasks | Activities that finished (or will finish) later than baseline | ≤ 5% | Status integrity |
| 12 | Critical path test | Does a delay on the critical path move the finish date by the same amount? | Must pass | Performance |
| 13 | CPLI | (Critical path length + total float) ÷ critical path length | ≥ 0.95 | Performance |
| 14 | BEI | Activities completed ÷ activities that should have been completed by the data date | ≥ 0.95 | Performance |
Group 1: Network integrity (checks 1–5)
Check 1 – Missing logic
An activity without a predecessor floats to the data date; one without a successor can slip indefinitely without moving anything. Either way its total float is fiction. In P6, open the Activities window, add the Predecessors and Successors columns, and filter for activities where either is blank. Exclude the project start and finish milestones, which legitimately have one open end.
How to fix it properly: ask what physically has to happen before and after the work. The classic cheat is to tie every orphan to the project finish milestone. It satisfies the metric and destroys the critical path, because every one of those activities now shows float measured to the end of the job.
Check 2 – Leads (negative lags)
A lead says a successor can start before its predecessor finishes, which is almost always better modelled by splitting the predecessor or using a Start-to-Start relationship. Leads also behave strangely when progress is applied. The target is zero, and I have never seen a reviewer accept "the software allows it" as a reason.
Check 3 – Lags
Lags are not wrong. Concrete curing, paint drying and regulatory notice periods are real waits. The problem is that a lag is invisible: it carries no description, no resource and no float of its own, and in P6 its calendar is set by a project-level scheduling option that many people never check. Anything over about 5% of relationships tends to signal that lags are being used to force dates rather than represent waits.
How to fix it properly: convert long or important lags into visible activities (for example "Cure slab L3 – 7 days" on a seven-day calendar), and keep the short, genuine ones with a note in the narrative.
Check 4 – Relationship types
The metric wants at least 90% Finish-to-Start links. SS and FF links are legitimate for overlapping linear work such as pipelines, road layers or façade drops. The issue is SS links without a matching FF, which leave the successor's finish unconstrained, and Start-to-Finish links, which are rarely justified in construction.
Check 5 – Hard constraints
DCMA itself does not publish a single list, but most analysis tools treat as "hard" any constraint that can override network logic. In Primavera P6 that usually means Mandatory Start, Mandatory Finish, Start On, Finish On, Start On or Before and Finish On or Before. Start On or After and Finish On or After are generally treated as soft.
Usually flagged as hard (P6)
- Mandatory Start
- Mandatory Finish
- Start On
- Finish On
- Start On or Before
- Finish On or Before
Usually treated as soft (P6)
- Start On or After
- Finish On or After
Hard constraints are where I find the most uncomfortable conversations, because they are often there for commercial reasons: a milestone someone wants to "hold". Mandatory constraints are the worst, because P6 will happily show an activity starting before its predecessor finishes and report positive float that does not exist.
How to fix it properly: replace contractual milestone constraints with Finish On or Before only on the contract milestones themselves, let logic drive everything else, and model external dependencies (access dates, permits, utility shutdowns) as Start On or After constraints on dedicated milestones with a clear source reference.
Group 2: Float and duration health (checks 6–8)
Check 6 – High float (more than 44 working days)
Forty-four working days is roughly two months. An activity with more float than that in a construction programme usually means something is missing downstream, most often a successor tied to the finish milestone rather than to the work that actually depends on it. Genuinely high float does exist (early procurement of long-lead items that are not yet on the critical chain, for example) and it is fine to explain it.
Check 7 – Negative float
Negative float means the schedule cannot meet a constraint with the logic as it stands. It is not a construction error; it is information, and it is frequently the most honest thing in the programme. DCMA expects negative float to come with an explanation and a corrective action plan. Hiding it by removing the constraint is the fastest way to lose a reviewer's trust. Our negative float field guide covers the six root causes in detail.
Check 8 – High duration (more than 44 working days)
Long activities are hard to status and hide what is actually happening. Within the detailed planning window, split them by area, level, chainage or system so that each piece has a clear start trigger and a measurable finish. Outside the detailed window (in a rolling-wave plan), planning packages longer than 44 days are often acceptable if your contract allows rolling-wave planning.
Group 3: Status integrity (checks 9–11)
Check 9 – Invalid dates
Actual dates after the data date, or forecast dates before it, mean the update itself is broken. In P6 this usually comes from progressing activities without moving the data date, from importing actuals from a site tracker that ran ahead, or from leaving "Remaining Early Start" in the past on in-progress work. The target is zero, and this is the one check I would never submit with a single exception.
Check 10 – Resources
This check simply reports how many activities carry no resources or cost. Whether it matters depends entirely on the contract. If your specification requires a resource-loaded or cost-loaded schedule, treat gaps as failures; if not, note in the narrative that the schedule is not resource-loaded and why.
Check 11 – Missed tasks
This compares baseline finishes that fell on or before the data date with what actually happened. A high missed-task percentage is not a construction problem; it is a performance signal. It belongs in the narrative alongside BEI, with the reasons.
Group 4: Performance (checks 12–14)
Check 12 – Critical path test
The idea is simple: add a large delay to an activity on the critical path, reschedule, and confirm the project finish moves by the same amount. If it does not, something is breaking the path: a hard constraint, an open end, a calendar mismatch or a "Finish On" constraint on the finish milestone. In P6 you can run this manually on a copy of the project by adding, say, 100 days to the remaining duration of a mid-programme critical activity.
Check 13 – Critical Path Length Index (CPLI)
CPLI compares the remaining critical path length plus project total float with the critical path length. A value of 1.0 means you are exactly on track to meet the target finish; below 0.95 is the usual warning point, because it means the team would need to perform noticeably better than plan to finish on time.
Check 14 – Baseline Execution Index (BEI)
BEI is a count ratio: activities actually completed divided by activities the baseline said should have been completed by now. It ignores size and criticality, so a BEI of 0.92 can mean "slightly behind on everything" or "badly behind on the few things that matter". Always read it alongside SPI and the critical path, and consider earned schedule for a time-based view.
A worked example: from 6 red cells to a defensible submission
The example below is a composite based on the kind of programme I review regularly, not a single named project. It is a 2,300-activity programme for a mid-rise hospital extension, prepared in Primavera P6 and submitted as an XER for the third monthly update.
- Invalid dates
- 37 → 0
- BEI
- 0.81 → 0.81
- CPLI
- 0.88 → 0.91
What we found first. Eleven percent missing logic, almost all of it in mechanical and electrical rough-in, where activities had been copied from a previous job with their relationships stripped out. Most of the 18.5% high float sat on exactly those activities. Nine percent hard constraints, nearly all of them Mandatory Finish constraints on floor handovers that the commercial team wanted "held". Thirty-seven invalid dates from actuals imported from a site tracker that ran three days ahead of the data date.
The sequence we fixed it in.
- 1. Run
- 2. Triage by group
- 3. Fix root causes
- 4. Re-run & compare
- 5. Record exceptions
- Invalid dates first. We moved the data date correctly and re-imported actuals with a cut-off. This took an hour and changed several near-critical paths.
- Logic second. The M&E team spent half a day with the planner walking each floor's sequence. We added about 260 relationships. High float dropped by more than two-thirds before we touched it directly.
- Constraints third. Mandatory Finish constraints on handovers became Finish On or Before on the four contractual sectional completion milestones only. Two handovers immediately showed negative float, which was the truth, and it went into the narrative with a recovery plan.
- Lags and durations last. Curing and testing lags became visible activities; three 120-day "M&E second fix" activities were split by floor.
What did not change. BEI stayed at 0.81 and CPLI moved only from 0.88 to 0.91. That is the point of this example: cleaning up the model makes the dates trustworthy, but it does not make the project any less late. The narrative said so plainly, and the client accepted the submission with comments on the recovery plan rather than on the schedule's construction.
Practical lessons learned from schedule reviews
- The scorecard is the cover, not the book. Reviewers use it to decide where to look. A clean score with a weak narrative still invites questions; a few explained exceptions with a strong narrative usually do not.
- Copied schedules fail in predictable places. Templates from previous projects bring stripped logic, wrong calendars and long summary-like activities with them. Check them first.
- Converted schedules need extra care. With Microsoft Project Online retiring at the end of September 2026, many teams are converting MS Project programmes into P6. Conversions frequently introduce lags, constraint changes and percentage lags that become fixed values. Run the DCMA check on the source and the converted file and compare. Our guide to converting MS Project schedules to Primavera P6 covers the seven differences that move dates.
- Trend the score, not just the snapshot. A schedule whose missing logic creeps from 2% to 6% over four updates is telling you something about how it is being maintained. See schedule entropy for why this happens.
Using AI for DCMA checks: where it helps and where it does not
One of the clearest trends of 2026 is the spread of AI-assisted schedule analysis, from features built into commercial platforms to planners exporting activity tables and asking a general AI assistant to find patterns. Used well, this saves hours. Used badly, it produces confident nonsense.
Good uses of AI
- Count and filter exported data
- Spot clusters by WBS or area
- Compare constraints, lags and durations
- Draft an exception log
Keep with the planner
- Physical correctness of relationships
- Contractual meaning of constraints
- Reasons for late completion
- Entitlement and delay responsibility
Good uses: counting and filtering an exported activity and relationship table against the fourteen thresholds; spotting clusters (for example "most missing logic sits in WBS 03.04"); comparing two updates to list which constraints, lags and durations changed; drafting the first version of the exception log in plain language.
Keep with the planner: deciding whether a relationship is physically correct; deciding whether a constraint is contractual; explaining why an activity finished late; any statement that touches entitlement or delay responsibility.
Expert tips for a defensible DCMA result
- 💡 Agree the rules up front. Ask the client which tool, which version of the metrics and which thresholds they will apply, and whether level-of-effort and summary activities are excluded. Many disputes are just two tools counting differently.
- 💡 Keep an exception log. One line per remaining exception: activity ID, check, reason, owner. Submit it with the schedule.
- 💡 Use activity codes to exclude legitimately. Code LOE, hammocks and milestones so they can be filtered consistently, and say in the narrative that you did so.
- 💡 Run the critical path test every update, not only at baseline. It is the quickest way to find a stray constraint someone added last month.
- 💡 Report the score next to SPI, CPI and float erosion. The DCMA score says whether you can trust the dates; the performance indices say what the dates mean. Our float erosion analyzer and critical path risk score help here.
Common mistakes that fool the score but not the reviewer
- Tying orphans to the finish milestone. Logic passes; high float explodes and the critical path becomes meaningless.
- Converting hard constraints to Start On or After without fixing the logic. The constraint count drops, but the dates are still being forced.
- Replacing lags with dummy "wait" activities that have no description or owner. The lag percentage drops; nothing has become more visible.
- Splitting long activities into equal halves. High duration passes; status reporting gets no better.
- Removing constraints to hide negative float. The schedule looks on time until the first reviewer asks where the contract milestones went.
- Submitting without moving the data date. Invalid dates multiply and every forecast is suspect.
- Treating BEI and CPLI as schedule-construction problems. They measure performance. You fix them on site, not in P6.
Pre-submission DCMA checklist
- Data date set correctly; no actuals after it and no forecasts before it.
- Every incomplete activity has a predecessor and a successor (start and finish milestones excepted).
- No negative lags; positive lags reviewed, long ones converted to activities.
- Hard constraints limited to contractual milestones, each with a source reference.
- Negative float explained with a recovery plan.
- High-float activities reviewed and either re-linked or explained.
- Long activities in the detailed window split where the work genuinely changes.
- Critical path test run on a copy; finish moves by the full delay.
- BEI, CPLI and missed tasks reported in the narrative with reasons.
- Exception log attached; tool and threshold set stated.
Conclusion
The DCMA 14-point assessment is one of the most useful habits a planner can build, provided you treat it as a diagnostic rather than an exam. Run it every update, fix root causes in the order that matters, record what remains, and be candid about what BEI and CPLI are telling you. Reviewers can tell the difference between a schedule that has been cleaned and one that has been groomed, and only one of those earns trust over a long project.
If you want to go further, our monthly schedule narrative template shows how to present exceptions so they read as control rather than excuses.
References
- U.S. Government Accountability Office. Schedule Assessment Guide: Best Practices for Project Schedules (GAO-16-89G), including the comparison with DCMA's 14-Point Assessment.
- Defense Contract Management Agency. EVMS compliance and IMS assessment guidance, including EVC-104 "Overview: 14 Point Assessment".
- Deltek Acumen documentation, "DCMA 14-Point Assessment Metric Descriptions".
- Oracle Primavera P6 Professional user documentation on constraints and scheduling options.
Frequently asked questions
What is the DCMA 14-point assessment?
It is a set of fourteen metrics developed by the US Defense Contract Management Agency to test whether a CPM schedule is built and statused well enough for its dates to be trusted. It covers logic, leads, lags, relationship types, hard constraints, high and negative float, long durations, invalid dates, resources, missed tasks, a critical path test, CPLI and BEI.
Is passing the DCMA 14-point assessment mandatory?
Only if your contract says so. DCMA itself describes the thresholds as a starting point for analysis rather than compliance triggers. Many owners outside defence use the assessment as a first filter, so a failing score usually means closer scrutiny rather than automatic rejection.
Why is 44 days used for high float and high duration?
Forty-four working days is roughly two calendar months. Activities longer than that are hard to status reliably, and float greater than that usually signals missing downstream logic. Both are review prompts, not absolute rules.
Which Primavera P6 constraints count as hard constraints?
DCMA does not publish a single list, but most analysis tools treat Mandatory Start, Mandatory Finish, Start On, Finish On, Start On or Before and Finish On or Before as hard, because they can override network logic. Start On or After and Finish On or After are usually treated as soft. Confirm the classification your reviewer's tool uses.
What is a good BEI and CPLI?
Both are commonly benchmarked at 0.95 or above. A BEI below 0.95 means fewer activities have finished than the baseline planned; a CPLI below 0.95 means the team must perform better than plan to meet the target finish. They are performance measures, so improving the schedule model will not raise them.
Can I run the DCMA 14-point assessment in Primavera P6 without extra software?
Partly. You can build filters and layouts in P6 for most counts, such as missing logic, constraints, high float and long durations, and run the critical path test manually on a copy. Dedicated schedule analysis tools automate all fourteen checks and trend them across updates, which is worth it on larger programmes.
Can AI run a DCMA check for me?
AI assistants can count and filter exported schedule data against the thresholds, cluster problems by WBS or area and draft an exception log. Always ask for the activity IDs behind each number, and keep decisions about logic, constraints and delay causes with the planner.
How often should I run the assessment?
Every update, and on the baseline before it is submitted. Trending the results over several updates is more useful than any single snapshot, because it shows whether the schedule is being maintained or slowly degrading.
Where this article connects
Curated cross-links: related Academy articles, the Knowledge Pillars this topic draws on, and the calculators referenced in the FAQs above.
Related Academy articles
Relevant Knowledge Pillars
Next steps on PMMilestone
Use these pages to deepen the topic, verify terminology, compare real cases and move from theory into applied project controls practice.
Related calculators
Open the calculators referenced in this article and run them against your own project numbers.
Float Erosion Analyzer
Track total float consumed on critical paths.
Open ScheduleCritical Path Risk Score
Score the fragility of your critical path.
Open ScheduleDelay Impact Calculator
Estimate the financial impact of project delays.
Open Earned ValueSPI Calculator
Schedule Performance Index — measure schedule efficiency.
Open ScheduleEarned Schedule Calculator
Time-based schedule performance (SPI(t)).
Open ReportingPM Health Score
Composite project health score 0–100.
OpenOther learning tracks
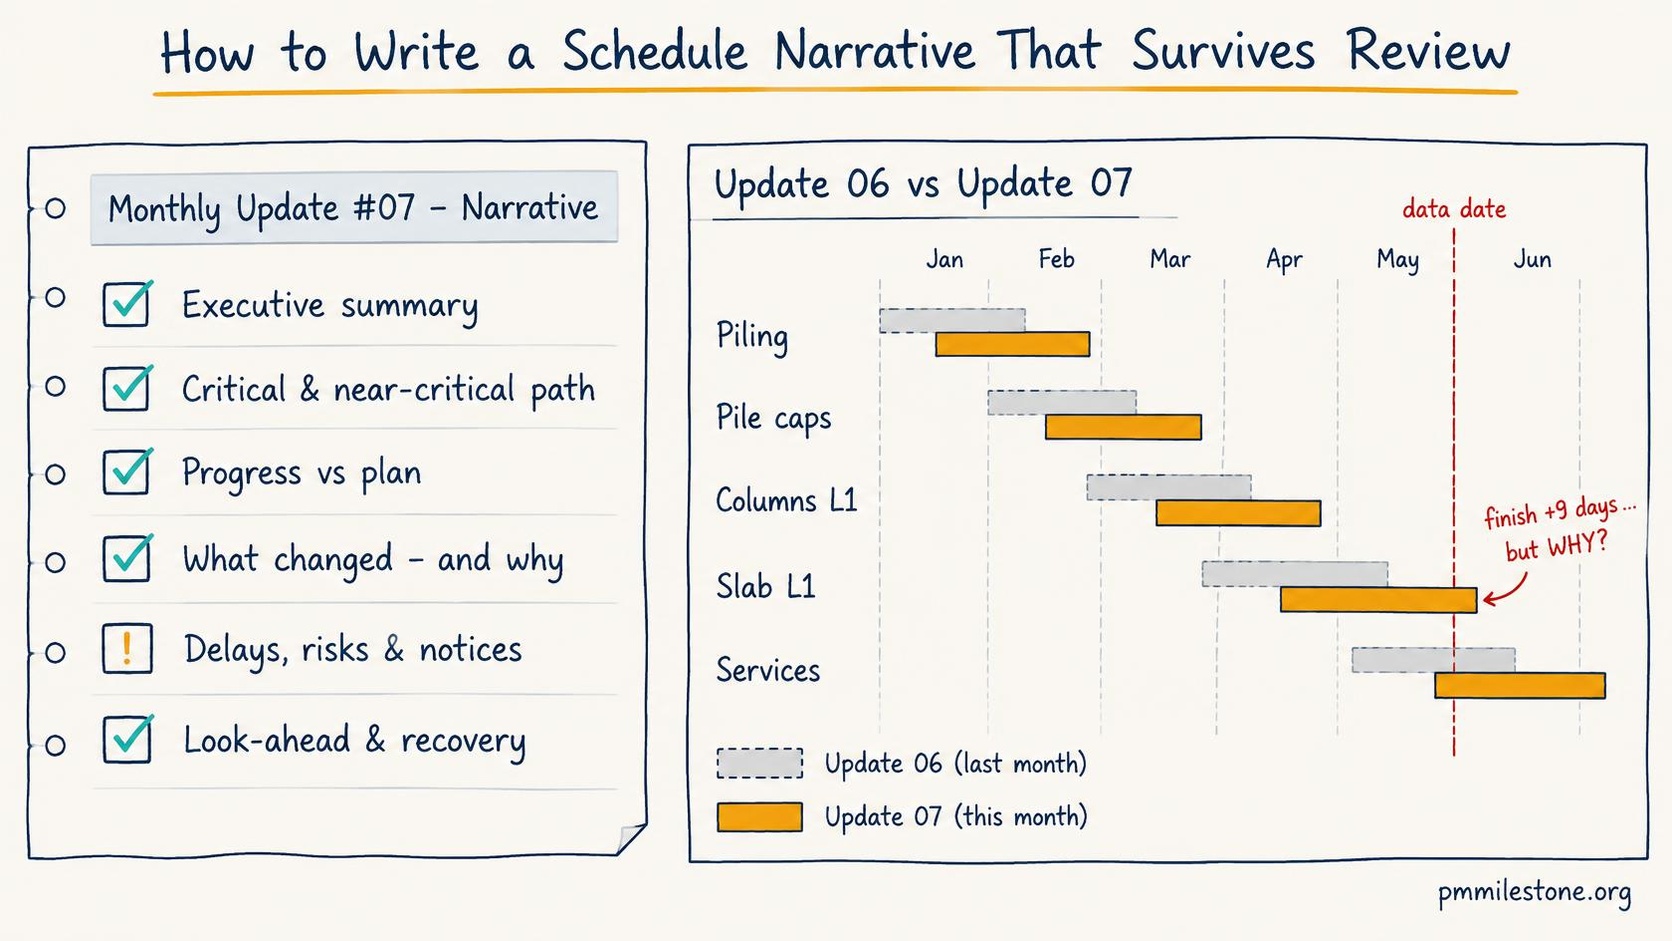
How to Write a Schedule Narrative That Survives Review
Write monthly schedule narratives that answer what happened, what changed, so what and now what — with a seven-part template, worked example and checklist.
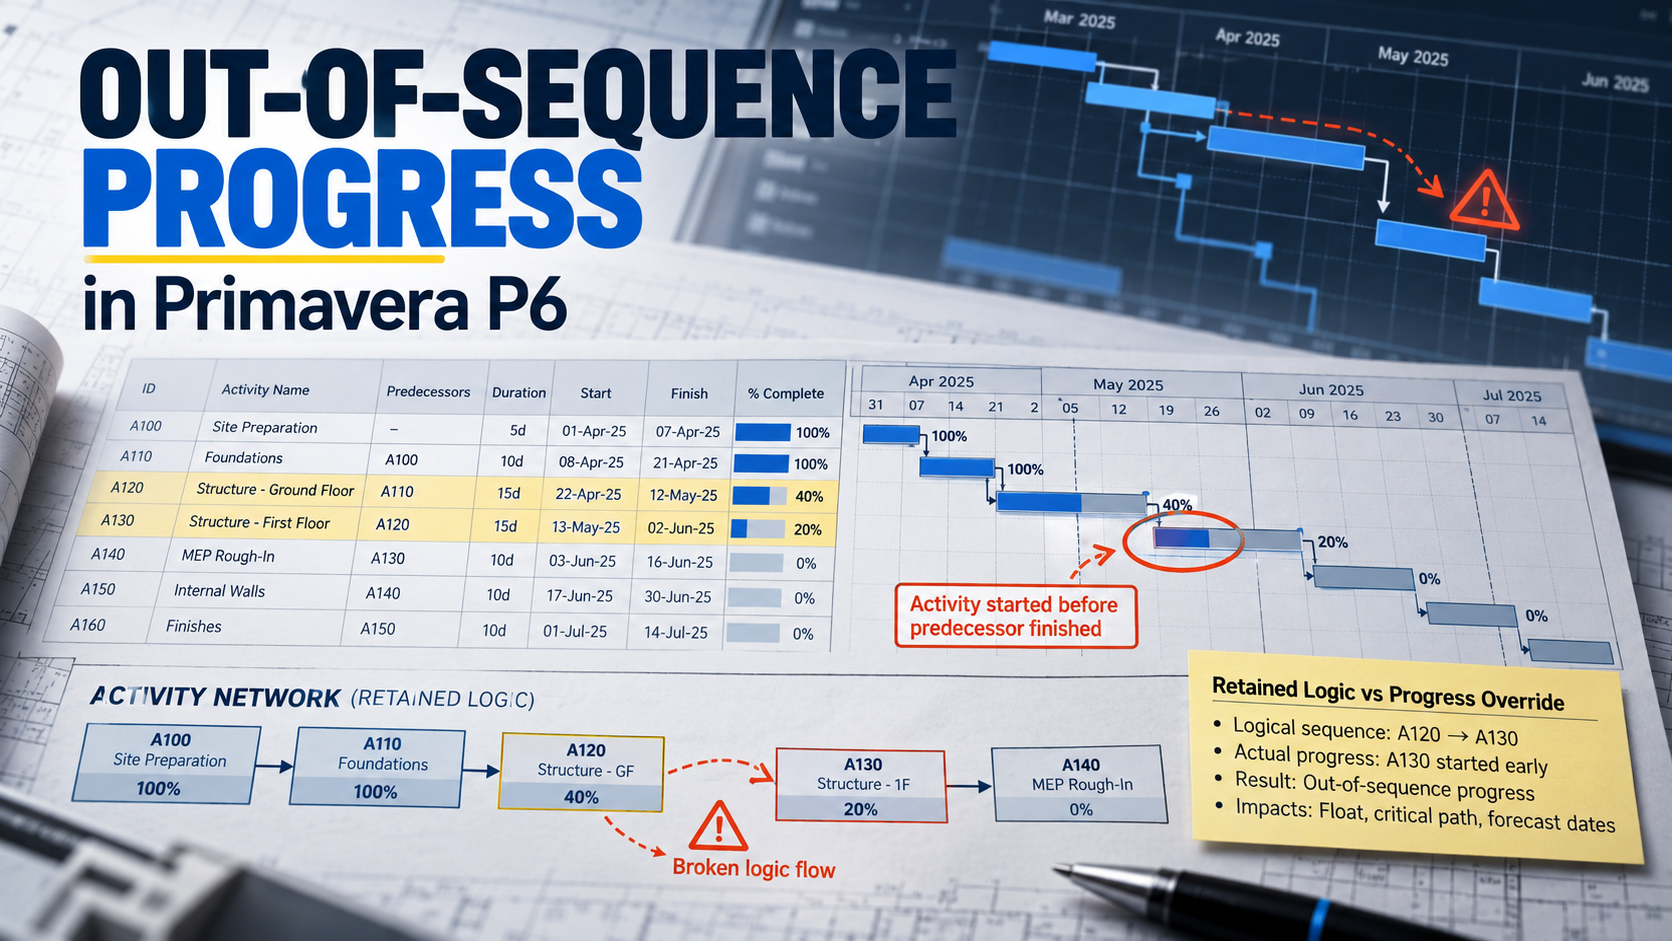
How to Fix Out-of-Sequence Activities in Primavera P6 Before They Distort Your Critical Path
Repair out-of-sequence progress with a five-step workflow, a DN600 pipeline example, scheduling-option comparisons and a monthly evidence checklist.
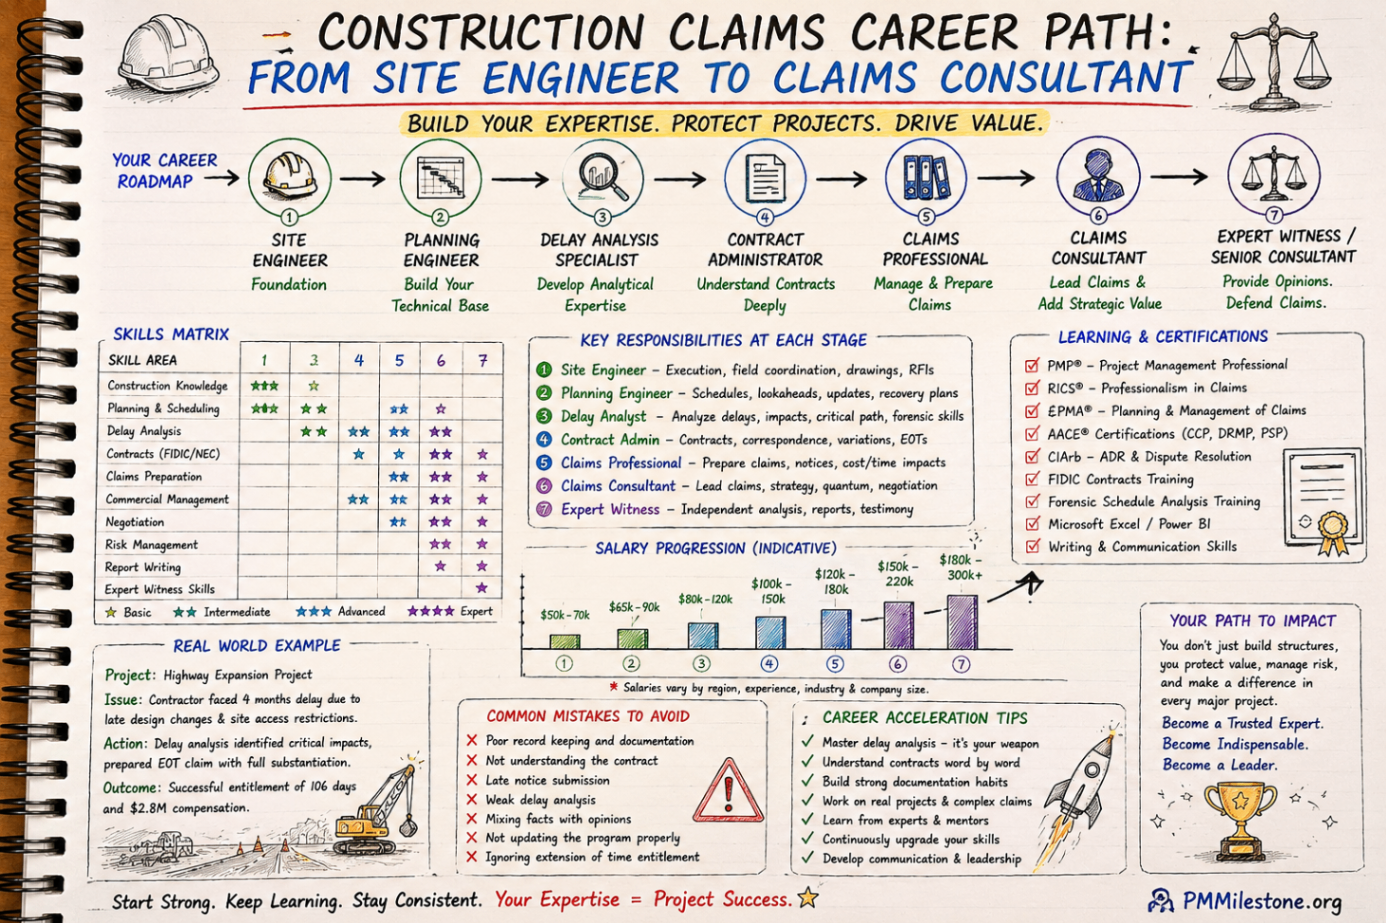
Construction Claims Career Path
A practical roadmap for engineers moving from site delivery into planning, delay analysis, claims, commercial controls and senior claims consulting.